Checking Errors
Here is a great recommendation from Jim Corbin:
There are two main places to check for configuration and runtime errors when you are developing solutions for Project Server. The Unified Logging Service (ULS) trace logs can be more detailed than the application event log.
· Application events In the Start menu on the Project Server computer, click Run, and then type eventvwr. In the left pane of the Event Viewer window, click Application to see the events logged by Project Server, Windows SharePoint Services, ASP.NET, SQL Server, custom event handlers, and other applications. The Project Server event sources include ProjectQueueService and pjevtsvc.
· ULS You can configure the ULS trace log to record specific or all categories and levels of activities in Project Server and SharePoint. To view the trace logs, you can use Windows Notepad, Microsoft Excel, or the Log Viewer add-in feature for SharePoint. Log Viewer is a useful download that is available from CodePlex.
To configure the ULS trace log for a specific Project category:
1. Open the SharePoint 3.0 Central Administration application, click Operations, and then click Diagnostic logging in the Logging and Reporting section.
2. In the Event Throttling section, select a specific category such as Project Server - Server-Side Events. If you select Project Server - General, all Project categories will be logged.
3. Select the Verbose level for the least critical event to report in the trace log.
Caution Run verbose logging only when you need it. Especially on a production server, select only a specific category. The size of logs can grow to be large. To turn off all logging, select the empty category and None for the trace log least critical event. To record relatively few events, select High or Monitorable.
4. Use the default path for the trace logs, for example, C:\Program Files\Common Files\Microsoft Shared\Web Server Extensions\12\LOGS\. If you use the Log Viewer add-in for SharePoint, it looks for trace logs in the default path.
5. The default maximum number of log files to maintain is 96.
6. The default number of minutes to use a log file is 30. That is, ULS tracing creates a new log file after 30 minutes. Log files include the date and time in the filename, for example, SERVERNAME -20070424-1612.log.
To use the Log Viewer add-in for SharePoint:
1. Download and install the Log Viewer feature from CodePlex SharePoint 2007 Features. See the Releases tab for the list of downloads. The release notes include installation instructions.
2. The Log Viewer is a global feature. After it is installed, click Operations on the Central Administration page, and then click View Unified Logging Service in the Utilities section.
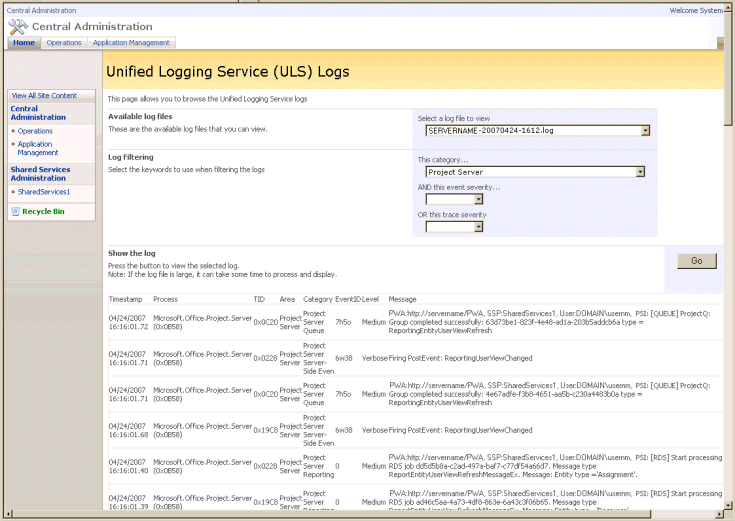
3. On the Unified Logging Service (ULS) Logs page, select a file to view, and then select the Project Server category. That shows all of the specific categories such as Project Server Queue, Project Server Server-Side Events, Project Server Reporting, and so forth.
4. To see all events in the ULS log, leave the trace severity drop-down list blank. If you select Verbose, that shows only the verbose level events.
5. Click Go.
Log Viewer add-in for SharePoint showing a ULS log for Project

Comments
Anonymous
January 18, 2009
PingBack from http://www.keyongtech.com/1904915-turn-off-verbose-loggingAnonymous
June 20, 2009
I have enabled diagnostic logging however the logs being created are of 0KB each. I have enough disk space ( just to be sure I provided a location in my external HDD) which has 176 Gigs. (again empty log files of 0 KB each in it). I am not throttling anything so that any and every thing is captured. There are no relevant errors in the event logs. I have already restarted the WSS timer service and tracing service many times. Even did an IISRESET. My present settings is 96 files of 30 minutes each, I reduced it to 1 file of 30 minutes but to no avail. Any pointers?Anonymous
June 20, 2009
I just enabled verbose logging and now logs ar egetting filled. Howver I fail o understand what configuration is required if I want to log everything? Also whatever I selection I made in 'diagnostic logging page for category and "Least critical event to report to the trace log " is not showing up. any idea why?