How to use WCF Performance Counters with NAV 2009 Server
NAV Server (middle tier) utilises Windows Communication Foundations (WCF), which includes a number of performance counters that you can use to monitor NAV Server performance in real-time. This example shows how to monitor "Calls Per Second" for NAV Server to get some idea of how busy it is over a working day / over time. Many other counters are available.
Enable Counters
First, enable WFC Performance Counters as described in this article WCF Performance Counters:
1) Use Notepad to edit "Microsoft.Dynamics.Nav.Server.exe.config" in the NAV Service folder (default is C:\Program Files\Microsoft Dynamics NAV\60\Service).
2) Add the section below, marked with Red:
<?xml version="1.0" encoding="utf-8" ?>
<configuration>
<appSettings file="CustomSettings.config" />
<system.diagnostics>
<assert assertuienabled="false" />
</system.diagnostics>
<system.serviceModel>
<diagnostics performanceCounters="All" />
</system.serviceModel>
</configuration>
3) Restart NAV Server.
Watch Counters
Use Windows Performance Monitor to select and view counters from NAV Server:
1) Start Windows Performance Monitor (Start -> Run -> Perfmon.exe)
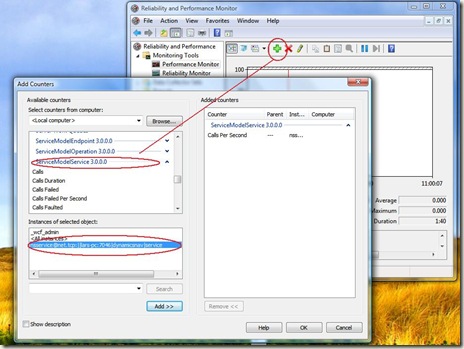
2) Add a Counter, then from available categories, select ServiceModelService. This will list the NAV Server, so select this. Then add the counter(s) you are interested in - in this example "Calls Per Second":
I found that in a stand-alone situation, the only counter that really shows anything is "Calls Per Second". But in a multi user system, this could well be very different - please share your experiences here.
These postings are provided "AS IS" with no warranties and confer no rights. You assume all risk for your use.
Best regards
Lars Lohndorf-Larsen
Microsoft Dynamics UK
Microsoft Customer Service and Support (CSS) EMEA
Comments
- Anonymous
May 18, 2009
PingBack from http://microsoft-sharepoint.simplynetdev.com/how-to-use-wcf-performance-counters-with-nav-2009-server/
