Windows Service Monitoring (reduce false alerts…part 2)
Shortly after posting the sample Windows service monitoring library, I realized a “short” follow-up article was in order to explain how to use the monitor types defined in the library.
First and foremost, any management pack that includes discoveries, rules or monitors should be sealed. The reason behind sealing the types of management packs is to retain version control of the MP. Without version control, anyone with the privilege to modify these workflows in the Operations Console can change something that wasn’t intended to be changed, and there would be no way of knowing a change was made unless you had a solid auditing process in place. Not to mention, this leaves the door open for someone to store an override in your monitoring MP.
This override confusion is now resolved in OM12, where we need to select a management pack before continuing.
This rule also applies to type libraries. Type libraries are a special kind of management pack, in which there really aren’t any monitoring workflows defined. The sole purpose of a type library is for the author to share monitor types and other types of data sources and composite modules. The only way to make these types and composites available for use in other management packs is to mark them as public and seal the management pack.
With that being said, the first thing you’ll want to do with the sample Service.Monitoring.Library.xml file is to seal it. I’ve got a walkthrough article here if you’re new to sealing MP’s.
Now that you’ve sealed the library MP, how can you leverage the monitor types defined in it? Well, this is one of the main reasons for type libraries – to make it easy for the MP author to reuse code that serves a certain function. In this case, the service monitoring library offers two options for a consecutive sample service monitor.
· Check Service State Consecutive Samples Monitor Type
· Check Service State Consecutive Samples with Scheduler Monitor Type
If you have already taken a look at the type defined in the MP, you might have noticed that I included some basic instructions for use. Taken from the description of the monitor types:
“This monitor type includes a consolidation module. If the service is not running for X number of consecutive samples within the configured time window, then generate state change event and alert.
Formula for ConsolidationInterval: (ConsolidationNumberOfSamples * Interval) + (ConsolidationNumberOfSamples * Interval) / 10
Also includes a scheduler module which dictates days and times when workflow will run. Start and End times are based on 24 hours clock (00:00). Days of week mask is a bit mask, with Sunday=1 through Saturday=64. Add selected days together to arrive at the DaysOfWeekMask value. Example: Monday - Friday = 62.
Overrideable parameters: StartTime, EndTime, DaysOfWeekMask”
The first part of the description above applies to both monitor types. The second, highlighted part only applies to the type that includes the scheduler module. Now that we understand the basics of what these types will do for you, let’s talk a little more about actually creating your new monitor that leverages each of these types. I’ve also attached My New Windows Service Monitors management pack to this post, containing the examples in this walkthrough for your reference.
Using the Check Service State Consecutive Samples Monitor Type
· Create a new empty management pack in the Authoring Console.
· Add a reference to the sealed Service Monitoring Library.
· Create a new custom unit monitor and give it a name.
Example: My.New.Windows.Service.Monitors.Dhcp.2SamplesIn30Minutes
· Configure the general tab as follows

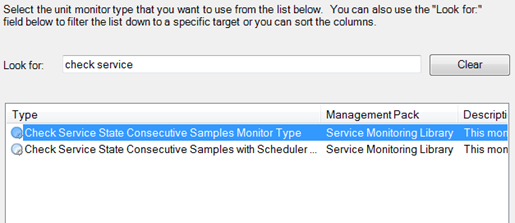
· On the configuration tab, browse for a type and select the Check Service State Consecutive Samples Monitor Type.

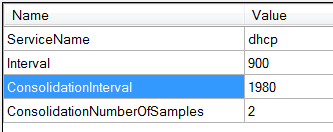
· Configure the module as follows.

o ServiceName = dhcp (the name of the service we want to monitor)
o Interval and ConsolidationNumberOfSamples work together. Multiply these two values equals the total seconds the service can be in a not running state before state change and alert generation. In this example, 30 minutes (900 seconds * 2). If it’s acceptable to receive an alert after one hour of service not running, it would look like 1800 seconds * 2. In my opinion, it’s not practical to configure this type of monitor beyond 2 consecutive samples. I suggest always using 2 for ConsolidationNumberOfSamples, and just scaling the Interval parameter to meet your SLA or acceptable unhealthy condition duration.
o We arrive at the ConsolidationInterval value with the formula (ConsolidationNumberOfSamples * Interval) + (ConsolidationNumberOfSamples * Interval) / 10.
In this example, this would be (900 * 2) + (900 * 2) / 10.
…or 1800 + 180, for a calculated value of 1980.
The reason behind the formula is to buffer our detection window to cover any delays in execution time. The health service will queue up monitors to run when scheduled, but sometimes there could be a few seconds delay between queue time and actual runtime. We don’t want to miss this detection window due to a slight backlog in the health service queue, so we add 10% of the total sliding window time to be on the safe side.
· Now map monitor conditions to health states.

· Fill in your alert settings (if you want an alert).

· Lastly, mark the monitor Public and set category to AvailabilityHealth.

That’s it. You’re ready to seal your new management pack and import. Remember the rule of thumb – always seal a management pack that includes discoveries, rules or monitors to retain version control!
Using the Check Service State Consecutive Samples with Scheduler Monitor Type
I’ll briefly talk about the other monitor type in the library, but will only describe the additional scheduling module parameters. The other parts of this monitor type are identical to the one without the scheduler.
The purpose of the scheduler is to configure the monitor to drop monitor output during times outside of the scheduled parameters. The workflow does in fact still run, but will not process any write actions (state change or alert generation).
For example, given the same configuration of the monitor above and a monitor schedule from 9:00am – 5:00pm, if the DHCP service was not running from 6:00pm to 8:00am, we wouldn’t have any indication of this in the Operations Console because the agent will not send any write action up to the management server.
Given the same configuration example, if the service were to stop running at 6:00pm and remained in this state beyond 9:00am, we would see a state change and alert generation at the next sampling interval after our scheduled start time if the DHCP service was still not running. Since there is no sync time on this monitor, the next sample could be anywhere from 9:00am to 9:14am.
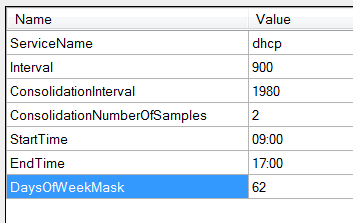
Now back to the configuration of the monitor type with the scheduler module. Again, given the same configuration as the first monitor we created, let’s say we want to schedule the monitor to run on Monday – Friday, between 9:00am – 5:00pm.
· StartTime = when monitor should start to send state changes and alerts.
· EndTime = when monitor should stop sending state changes and alerts.
· DaysOfWeekMask = on which days should the monitor send state changes and alerts.
Two things to note; start and end times are based on a 24-hour clock, and DaysOfWeekMask is a bitmask starting on Sunday (1). More information about days of week mask values can be found here.
At the beginning I mention a short follow-up with in order. So much for “short” follow-ups…
My.New.Windows.Service.Monitors.xml
Comments
Anonymous
January 01, 2003
Christo - you'll need to use the Authoring Console that comes with the R2 Resource Kit download. The instructions here are not for the authoring space in the Operations Console. After you seal the XML file you downloaded here, you can go into the Authoring Console and add this service monitoring MP as a reference, then follow the instructions here. -Thanks, JonathanAnonymous
January 01, 2003
Pavel - I'm not sure what you mean. Can you give an example?Anonymous
January 01, 2003
>The health service(HS) will queue up monitors to run when scheduled...so we add 10% of the total sliding window Monitor is workflow, workflow is set of modules, one of the modules in scheduler which initially timestamps DataItem. Then it does not matter how much time it will take to process other modules. Initial timestamp is used for each subsequent module. Based on my observations and delving SCOM traces, c#,asm I saw that Scheduler module always triggered even with under heavy HS load and Scheduler's time was used for DataItem and not start time of the last module. Example with 300 sec interval and 3 for NumberOfSamples. HH/MM/SS 00:00:00 triggers window - process status is not running, count=1 00:05:00 process status is not running, count=2 00:10:00 process status is not running, count=3, outputs My assumption/observations are as follows: "00:10" will almost all the time be "00:10" or plus/minus seconds. You insight is as follows: 00:10 may be shifted to 00:11 under some conditions inside HS. and that is why you try to add 10% to detection window. Right? If my observations are correct than using "ConsolidationNumberOfSamples * Interval" + Latency parameter to wait backlogged DataItems will be enough. Maybe "ConsolidationNumberOfSamples * Interval"+10seconds and Latency=120Anonymous
January 01, 2003
Hello Jonathan, Thank you for sharing. Much appreciated, it is exactly what I need. Can you please give me click-by-click guide to get this - I am unable to create a New monitor that uses your library. I can only create a new UNIT Monitor which does not refer to your code - how do I point to your library for this ? The step where I need guidence is · Create a new custom unit monitor and give it a name I can start the Create Monitor but what do I select from the drop-down for type of Monitor to create? Selecting Windows Services/Basic Service Monitor does not give me access to the items/tabs you mentioned in your article. i erally would appreciate a reply. My email is steech0a@aramco.com.sa Regards ChristoAnonymous
January 01, 2003
I am not familiar with the Latency parameter. Would like to see it used in your implementation. Thanks!Anonymous
January 01, 2003
Hi Marc - you're right. I didn't notice that. You'll want to change those around :)Anonymous
January 01, 2003
I stumbled onto this article and tried to implement it. Unfortunately it does not work yet. While going through it again I saw that your screenshot of the Health Tab (Map monitor conditions to health states) you set Running to Critical and Notrunning to Healthy. Is that correct and if yes whats the logic behind it? Seems to confuse me. Regards, MarcAnonymous
June 27, 2011
Very NICE!Anonymous
August 04, 2011
Hi Jonathan. Why don't you use parameter 'Latency' instead of 10% buffer? msdn.microsoft.com/.../ee809367.aspx
