How to monitor your Windows Azure application with System Center 2012 (Part 2)
In the first part of this article (https://blogs.technet.com/b/dcaro/archive/2012/05/02/how-to-monitor-your-windows-azure-application-with-system-center-2012.aspx), I have explained how to enable monitoring for a Windows Azure application. We have seen that you can enable it from the code of the application or you can enable performance monitoring as well as event log monitoring by leveraging Windows Azure Powershell cmdlets or third party application.
Once that configuration part has been done, we can work on the configuration of System Center 2012, more specifically the Operation Manager component (SCOM). This requires to have installed the “System Center Monitoring Pack for Windows Azure Applications” that you can download here :
https://www.microsoft.com/download/en/details.aspx?id=11324 (At the time this post is written, the management pack is targeting SCOM 2007 but it works with the 2012 release).
Once you have installed the Azure Management pack on your SCOM server, you will have to follow those steps :
- Create the appropriate accounts in Operation Manager to connect to your Azure environment
- Create a monitoring for your Azure application
- View the results of the performance counters collection
Let’s walk through these steps.
Create the appropriate accounts to allow SCOM to connect to Azure
You will need three “run as” account in System Center Operation Manager 2012 :
- One for binary authentication. This account will use the management certificate to connect to Azure.
- One for Basic Authentication. This account will be used for the certificate
- One that will be used for the proxy agent.
You will find the detailed step by step procedure on this blog : https://oakleafblog.blogspot.fr/2011/09/installing-systems-center-monitoring.html (Although it was made for SCOM 2007, the steps to create the accounts are still valid with SC 2012).
Create the monitoring of your Azure application
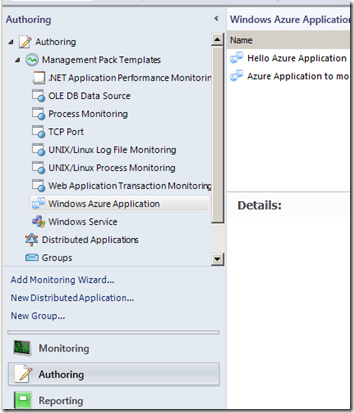
Because we have installed the monitoring pack for Azure, under the Authoring you can see the “Windows Azure Application” management pack template.
From there we select the “Add Monitoring Wizard” to create the monitoring for our Azure application. Select “Windows Azure Application” as the monitoring type.
Type a name and select a management pack for your application.
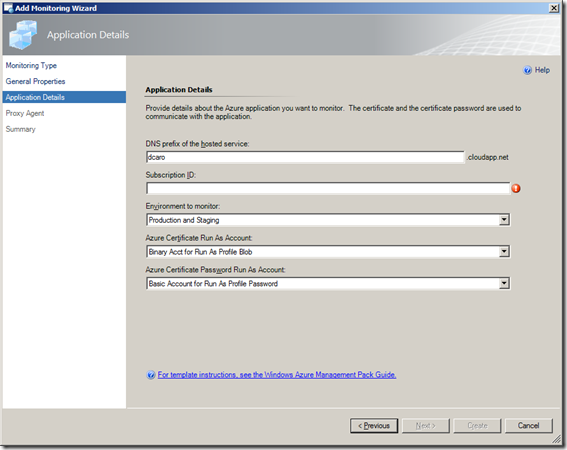
Make sure you have the following information from your Azure Application :
- DNS prefix of the application
- Your Subscription ID
All what you need to do is now fill in the wizard.
For the Azure Certificate Run As Account and the Azure Certificate Password Run As Account, use the accounts we have created in step 1.
Then specify the Proxy Agent which is the server you want to use to actually do the monitoring. In my lab, I’ve used the VMM Server but you can choose any server in your environment.
Review the summary and validate.
Go to the Monitoring tab and look for the "Windows Azure” node in the top left list.
After a while you will be able to see your azure application under the Windows Azure node. Be patient, it takes some time ! In my case, it took about 8 minutes.
Initially the application will appear as not monitored and then the empty green circle will change to a green circle with a green check mark.
View the results of the performance counters
Now we are ready to look at the performance counters themselves. You have to go to the "Performance” node still under the Monitoring tab.
Once the application has been discovered, Operation Manager will pull the data every 300 seconds. Again, be patient and the counters will appear in the bottom of the performance graph as you can see bellow.
From here you can create you own dashboard and / or publish it on Sharepoint if you want to give access to those graph to some people who do not have the SCOM console installed.
Enjoy the power and elasticity of Azure to deploy your applications with the control and insights brought to you by System Center Operation Manager 2012.
List of useful additional resources and blogs to read more about this topic :
- Windows Azure PowerShell Cmdlets : https://wappowershell.codeplex.com/
- System Center Monitoring Pack for Windows Azure Applications : https://www.microsoft.com/download/en/details.aspx?id=11324
- How to easily enable Windows Azure Diagnostic Remotely : https://www.davidaiken.com/2011/10/18/how-to-easily-enable-windows-azure-diagnostics-remotely/
- Windows Azure Diagnostics and PowerShell – Performance Counters : https://michaelwasham.com/2011/09/19/windows-azure-diagnostics-and-powershell-performance-counters/
- Introduction to the Monitoring Pack for Windows Azure Applications : https://technet.microsoft.com/en-us/library/gg276383.aspx
- Some exercises on collecting Logging Data by Using Windows Azure Diagnostics : https://msdn.microsoft.com/en-us/library/gg433048.aspx


