Console.Log : Say Goodbye to JavaScript Alerts for Debugging!
Admit it, you’ve done it. You have a bug somewhere in your web page and you add an alert to popup a useful message like “I am in the if statement” or “varName=Bob” to help you figure out what is wrong with your code. In IE9 we have an alternative: the Console object.
ASP.NET programmers who work in Visual Studio may already be familiar with the debug object. You call methods of the debug class in your .NET code to display messages in the Output window to help you debug your code in Visual Studio. The Console object is the IE9 equivalent.
Hopefully you have already discovered the Developer tools in IE8 and IE9. If not, just open your browser and go to a website, any website will do. Now hit F12. This will bring up the developer tool window. Now go to the Console tab.
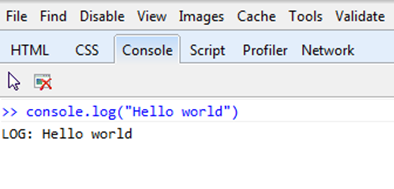
Now try typing console.log(“Hello world”) in the console command line at the bottom of the window. Your output should look something like this.
console.log will display the parameter passed to the log method in the console window. Use this method to display a string or variable in the console window.
You can use the console class in your code as well, much like we can use JavaScript alerts.
<script type = "text/javascript">
function tryConsole() {
console.log("hello world");
}
</script>
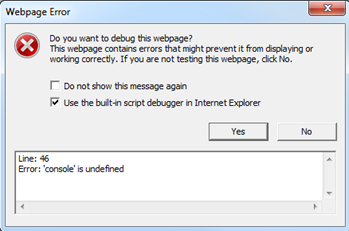
Keep in mind you will not be able to see the output unless you have the developer tools open. You can see the console output on either the Console or Script tabs. Be careful when using console for debugging. If you leave a call to the console object in your code when you move to production and you do not have the developer tools displayed you will get an error message telling you console is undefined. You will get the same error in Visual Studio if you Start without debugging.
To avoid the error message, you either need to remove all the console method calls from your code, or you need to add a check to make sure console exists before calling any methods. For example:
<script type = "text/javascript">
function tryConsole() {
if (typeof console != "undefined") {
console.log("hello world");
}
}
</script>
Now that you understand the the basics, let’s look at the different methods available with the console class.
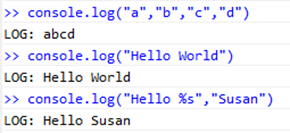
log(message[,object]) – the Log method accepts one or more parameters and displays them in the output window. It also accepts format strings.
warn(message[,object]) – accepts one or more parameters and format strings just like the log method, but displays the output with a warning icon.
info(message[,object]) – will display an information icon beside the output
error(message[,object]) – will display an error icon beside the output
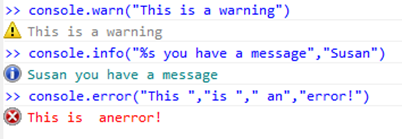 clear() – will clear the console output window
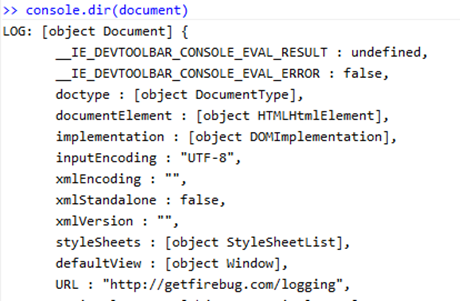
dir(object) –is an object inspection method that will list all the properties of an object
assert(expression, message[,object]) - will display the message or object contents if the expression is false
var debugging=false;
console.assert(debugging,"You are not debugging");
So there you have it, more tools to help you debug your web pages. No add-ons or extra software required. Just download IE9 and try it for yourself!
Since we are already playing around in the developer tools that brings me to today’s My 5
My 5 Cool Features in the F12 Developer Tools (in no particular order)
- Select element by click – Ever had trouble tracking down the HTML code for a particular element on your page. Select Find | Element by Click from the developer tools menu and then you can just click the element on the web page. The corresponding code in your HTML will be highlighted.
- Format JavaScript – It’s all about performance, we compress our JavaScript to reduce the number of bytes that are sent across the network, but then the code becomes almost unreadable to the human eye. Select the Script Tab, choose the Toolbox drop down (the little picture of the hammer and wrench) then select Format JavaScript. Bingo now your JavaScript is readable again!
- Browser mode - Developing for IE9 but want to know what your website will look like in IE8 or IE7? Just set the Browser Mode in the menu.
- Resize – How does your website appear on a smart phone? how about a tablet or slate? Choose Tools | Resize and then select a size or enter a custom size to ensure your website is user friendly on smaller devices.
- Change User Agent String – Debugging a web site that doesn’t seem to work in IE9? Could it be the programmer has written their code to use browser detection instead of feature detection so perhaps the code doesn’t know to check for IE9? You can change the user agent string and see if it works when the code thinks it is being displayed in another browser. Choose Tools | Change user agent string and select the desired value.
Comments
- Anonymous
July 11, 2011
I'd like to do this from VS2010. I enjoy the JS debugging environment there much better. I use F12 for DOM and CSS manipulation/testing, and flip over to VS for JS. How to write debug or console statements in that environment? I see console.log is an object (at least, entering "console.log" as a command in Immediate returns "{...}". What gives? - Anonymous
January 17, 2012
Very good information. Thank You!

