Server Activity History Report–MDW Report Series Part 3
By Bill Ramos, Program Manager, SQL Server Manageability Team
In part 2, I added the hyperlink to the MDW Overview report to launch the Server Activity History report. In this post, I’ll show how to get the data and display the thumbnails in the report for %CPU. I’ll follow up post 4 to include Disk I/O Usage, and Network Usage. I’ll go through how performance counters are stored in the MDW and one of the cool stored procedures in the MDW that gets the performance data and makes it chart ready. Finally, I’ll walkthrough how to create the CPU thumbnail chart.
Getting PerfMon Data from the MDW
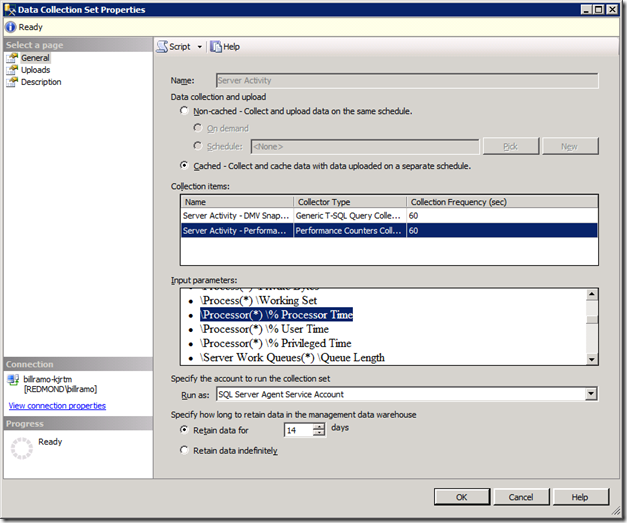
The Server Activity collection set is responsible for gathering the Performance Counters needed. This collection set gathers various DMVs and Performance Counters every 60 seconds and uploads the data to the MDW every 15 minutes by default. As shown below, you can view what counters the Server Activity collection set gathers by navigating to the Server Activity collection set under the Data Collection node in the Management folder in the Object Explorer and issue the Properties command.
The values for the performance counters are stored in the snapshots.performance_counter_values table. To save disk space, the counter name and object references are stored in the snapshots.performance_counter_instances table as a lookup. To get the values for an instance over the desired time period, you need to map the snapshot_id in the performance_counter_values table through the core.snapshots_internal and snapshot.source_info_internal tables. See the schema diagram below.
There is a complexity when reporting the percentage of CPU time for specific processes like SQL Server. Mainly, the value returned needs to be divided by the logical CPU count on the target instance. Needless to say, this is logic that you don’t what to include in the report definition.
Snapshots.rpt_generic_perfmon to the Rescue
I’d like to give Bart Duncan credit for coming up with idea of this stored procedure that gathers the performance counter values for the desired time period and returns a result set that makes it easy to to create charts against the data. This stored procedure is included as part of the shipping MDW and relies on the core.performance_report_group_items table for supplying the grouping information for charts used by the MDW. In a future post, I’ll show you how to report against performance counters that aren’t part of the Server Activity system collection, but that’s for another day.
Inside of the core.performance_report_group_items table, there are three groups defined for the thumbnail charts. Here is a query you can use to see the grouping for the thumbnails.
USE mdw
GO
SELECT
[counter_group_id]
,[counter_subgroup_id]
,[series_name]
,[object_name]
,[counter_name]
,[instance_name]
,[multiply_by]
,[divide_by_cpu_count]
FROM [mdw].[core].[performance_counter_report_group_items]

WHERE counter_group_id = 'ServerActivity' AND
counter_subgroup_id IN ('cpuUsage', 'IOUsage', 'networkUsage')
ORDER BY counter_subgroup_id, series_name
When you look at the results set, you’ll see a column called multiply_by. The value of 0.0000009537 is used to convert bytes to MB (1.0 / (1024 * 1024 ) ).
The rpt_generic_perfmon stored procedure takes the following parameters.
| Parameter Definition | Notes |
@ServerName sysname |
Instance name that maps to value from the mdw_overview report. |
@EndTime datetime |
UTC time for the last upload time. The default will be the UTC time for the report execution if it’s not provided. |
@WindowSize int |
Represents the time in minutes shown in the report. The start time for the report is @EndTime – @WindowSize. The default value is 240 (4 hrs). |
@DataGroupID nvarchar(128) |
Value for counter_group_id in core.performance_report_group_items. For all of the performance counters in this report, the value will be ‘ServerActivity’. |
@CollectionSetUid nvarchar(64) |
The GUID for the Server Activity collection set for this report – ‘49268954-4FD4-4EB6-AA04-CD59D9BB5714’ |
@interval_count int = 40 |
The number of data points to use in the chart given the @WindowSize. The default value is 40. |
Building Out the Server Activity Report
Now it’s time to get down to business. Open up the Server_Activity report using the Report Builder that we created in part 2 which us essentially a blank report with two parameters: ServerName and EndTime.
Report Parameters
ServerName. For testing purposes, I use the name of one of the server instances that reports into the MDW. The attached report will have blank value.
EndTime. To accommodate running the Server Activity report directly, we’ll add a default value to the EndTime parameter by going to the parameter dialog for EndTime, go to the Default Values page, use the Specify values option, and press the Add button. Paste the following expression in to the value that retrieves the current date in UTC format:
=DateTime.UtcNow
WindowSize. Next, we’ll create the WindowSize parameter using the Add Parameter command. Cal the name WindowSize and use Integer for the data type. Go to the Available Values page and select the Specify values option. You’ll add 5 values as follows:
| Label | Value |
| 15 minutes | 15 |
| 1 hour | 60 |
| 4 hours | 240 |
| 12 hours | 720 |
| 24 hours | 1440 |
For the default value, specify a the value of 240.
The remaining three report parameters will be setup has hidden parameters. We need to use parameters instead of the new Report Variable feature starting with Reporting Services 2008 because query parameters can only reference report parameters.
| Parameter Name | Data type | Visibility | Default Value |
| DataGroupID | Text | Hidden | ServerActivity |
| CollectionSetUid | Text | Hidden | 49268954-4FD4-4EB6-AA04-CD59D9BB5714 |
| interval_count | Int | Hidden | 40 |
Data Source
Like the MDW_Overview report, you will create a data source called MDW and point it to the shared MDW data source that you created in part 1.
Datasets
The Server Activity report will have one dataset – for now – called Perfmon that will be associated with the snapshots.rpt_generic_perfmon stored procedure. As shown below.
If you had no typos with the parameter names, Report Builder 3.0 matches each of the stored procedure parameters with the report parameter names, so it’s ready to use for your report objects.
CPU Chart
Now for some charting. We’ll start with the Chart Wizard, select the PerfMon dataset, and press Next.
Choose the Line and click Next.
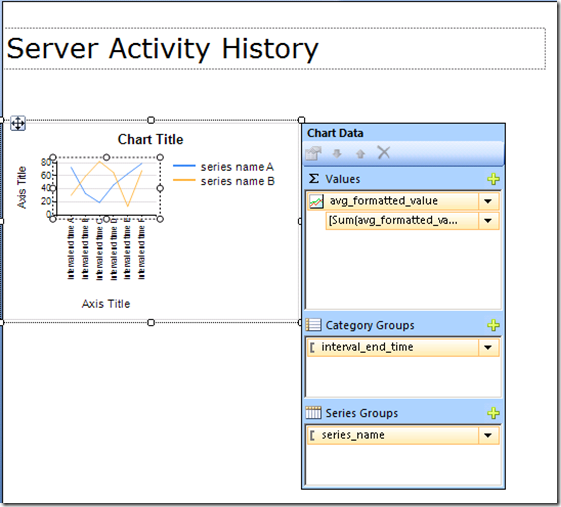
Drag the avg_formatted_value field into the Values box. This will be the value in the Y axis value represented as a percentage value from 0 to 100 for the CPU.
Drag the interval_end_time into the Categories box. This represents the number of interval_count values along the X axis.
Drag the series_name field into the Series box. There are two series values: SQL Server and System.
Click Next to go to the style page. Pick the style that suits your taste and click Finish to complete the wizard. I’ll use Generic for the style. If all went well, you should see a chart that looks like this:
Before attempting to run the report – it’s tempting – there are a bunch of tweaks we need to make to the chart.
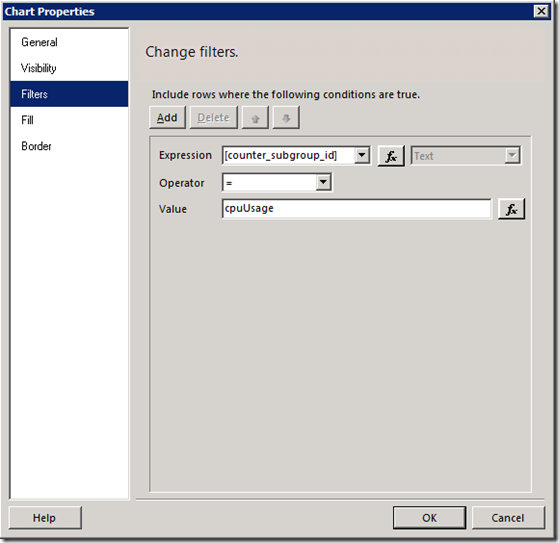
Change filters. We need to add a filter to the chart that shows only the counter_subgroup_id = cpuUsage. Right click on the Chart and choose Chart properties. Go to the Filters page and click Add. For Expression, select [counter_subgroup_id], Operator is =, and Value is cpuUsage.
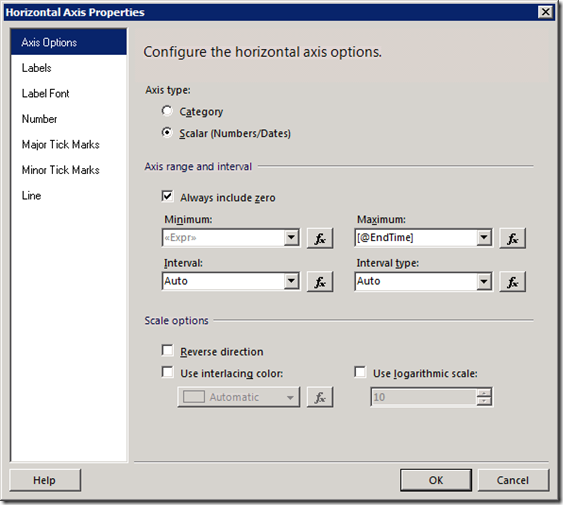
Horizontal Axis Properties. We need to set the minimum and maximum values based on the WindowSize and EndTime. Right click on horizontal labels along the X-axis for the chart and choose the Horizontal Axis Properties command. Complete the dialog as follows:
Choose the Scalar for Axis type. This allows the entire range of numbers to get charted out that match the WindowSize. If you forget to do this, in cases of missing values for the WindowSize (collector was turned off or instance was down), the chart will look look like you have data because it’s charting the discrete values over the range.
Setting the Axis range and interval. For the Minimum expression, we’ll use the following expression:
=DateAdd ("n", -1 * Parameters!WindowSize.Value, Parameters!EndTime.Value )
This sets the start range to be the EndTime – WindowSize. For the Maximum value, set the it to: [@EndTime].
Labels. On the Labels page, you want to check on Hide axis labels. There is no room in the thumbnail chart to show labels for the 40 data points.
Major Tick Marks. On the Major Tick Marks page, check on the option to Hide Major tick marks. This just adds noise to the chart.
After you click OK, you then need to select the Axis Title label under the horizontal axis and delete it. This is because we want to use this space for the Series labels.
Vertical Axis Properties. Settings for the Y-axis are a little simpler since we are dealing with a percentage value. Set the minimum value = 0 and the maximum value = 100. We’ll leave major tick marks on and show labels. For the Axis Title, change the text to ‘% CPU’.
Series Legend. To move the series legend to the bottom of the chart, right click on the legend and select Legend Properties. Then, choose the Legend position as shown below.
Finally, you will want to change the Chart Title to % CPU. Your design surface should look like this:
You can now Run the report and if you did everything correctly and your data collector was collecting data and uploading, you should see something like this.
Let’s add one more label on the report to display the report range of data in local time – just like the shipping report.
Switch back to Design mode.
Use the Insert menu and select a Text Box and drag out a text box just under the report title for the length of the report.
Click the Center paragraph command.
Paste in in the following expression:
 = "Selected time range: " &
    code.UTCToLocal( DateAdd("n", -1 * Parameters!WindowSize.Value, Parameters!EndTime.Value)) &
   " to " &
    code.UTCToLocal( Parameters!EndTime.Value)
When you click outside of the text box, the expression text gets replaced with the Expr tag.
This post is getting pretty long, so it’s time to stop here. You should now know how performance counters are stored in the MDW; how to use the snapshots.rpt_generic_perfmon stored procedure to retrieve the data and the role of the core.performance_co8unter_report_group_items table; and, how to create a thumbnail chart to display the cpuUsage.
In the attached ZIP file, I’ve included the mdw_overview.rdl and the new server_activity.rdl files. If you are enjoying this series and find it useful, feel free to add your comments.
Technorati Tags: Data Collector,SQL Server 2008,SQL Server 2008 R2,SSMS Reports,MDW


