Best Practices for Instrumenting High Performance BizTalk Solutions
During a recent technical engagement with a BizTalk ISV, we helped the ISV partner implement a tracing framework which combined the high performance and flexibility provided by the Event Tracing for Windows (ETW) infrastructure. This work has enabled us to produce and validate the foundation of the best practices for instrumenting BizTalk solutions. We are keen to share our lessons learned with the community to enable BizTalk developers to take advantage of the ETW infrastructure and enrich their solutions with high-performance instrumentation internally adopted by many Microsoft products.
Background
Code instrumentation has always been crucially important in complex software solutions. Rich tracing and logging enables collecting detailed telemetry and diagnostic information to understand application behavior and facilitate troubleshooting. This is especially important for server applications and BizTalk Server based-applications are surely among them.
We have seen many instances where BizTalk developers often add tracing and logging capabilities to their applications using inefficient methods and this can have adverse effect on the application performance. From the other side, BizTalk developers appear to be unaware of high-performance tracing capabilities which are provided directly by BizTalk. This article will help bridge the gap.
Challenges
The ISV partner has initially implemented component-level tracing by taking dependency on the System.Diagnostics.Trace component in the .NET Framework. They also considered using a third-party logging/tracing component log4net . Both options didn’t deliver the desired level of agility and performance.
The main observations can be summarized as follows:
- The CPU utilization was 85-90% on average when developers were running the DebugView tool to monitor the BizTalk application behavior. The tool was consuming the vast majority of the CPU time due to many events being logged by the BizTalk application.
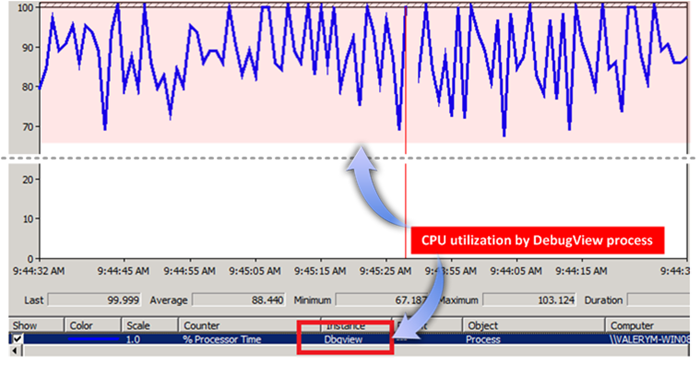
- Running DebugView during stress testing was significantly impacting application performance. DebugView acts as a debugger and hooks on the OUTPUT_DEBUG_STRING_EVENT event. As a result, the BizTalk application was experiencing a performance impact as the application threads will be suspended whilst the debug information is written to the trace listener.
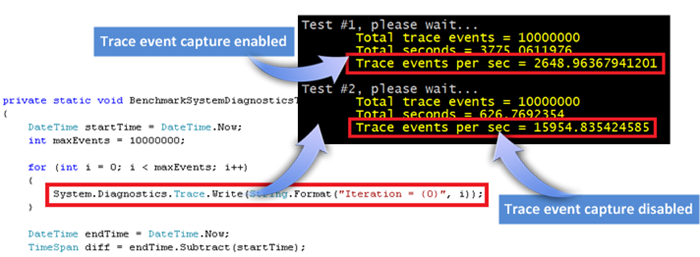
- Poor tracing performance. The .NET Framework’s standard System.Diagnostics.Trace component which is often being used for instrumenting .NET applications was able to handle anywhere between 2000 and 8500 trace events per second when event capture was enabled in the DebugView tool.
- Any changes in the tracing configuration such as enabling, disabling or changing the trace level required a restart of the BizTalk host instances. Although this doesn’t impose any critical issues in the development or test environments, the need for application restart may be highly undesirable or even unacceptable in the production environment.
Solution
Our proposed implementation leveraged the ETW infrastructure which enabled us to take advantage of the general purpose, high-speed tracing facility provided by the OS kernel. It turned out that we didn’t have to write our own custom providers. During the analysis phase, we discovered what can be generally described as a hidden gem inside the BizTalk runtime engine called TraceProvider from the Microsoft.BizTalk.Diagnostics namespace in Microsoft.BizTalk.Tracing.dll. As things stand at the moment, this class has not as yet been fully documented despite that it is being extensively used virtually by all major infrastructure components inside the BizTalk runtime, including EPM, transport adapters, Message Agent, etc.
The Microsoft.BizTalk.Diagnostics.TraceManager class implements an ETW provider and exposes the following key properties and methods which have been leveraged in our prototype:
 namespace Microsoft.BizTalk.Diagnostics
{
    [ComVisible(true)]
    [Guid("748004CA-4959-409a-887C-6546438CF48E")]
    public sealed class TraceProvider
    {
        public TraceProvider(string applicationName, Guid controlGuid);

        public uint Flags { get; }
        public bool IsEnabled { get; }

        public void TraceMessage(uint traceFlags, object format);
        public void TraceMessage(uint traceFlags, object format, object data1);
        // + a few more overloads of TraceMessage accepting extra data items.
    }
}
Below is the class diagram for the tracing framework:

The key player in the tracing framework is the ComponentTraceProvider class which is simply acting as a wrapper for TraceProvider and provides a richer choice of tracing methods for various types of events such as informational, warnings, errors and exceptions. We also added the support for tracing method calls, measuring durations using high-resolution timers and ability to correlate events using Guid-based tokens.
The ComponentTraceProvider class implements the following methods:
 // Writes an information message to the trace.
void TraceInfo(string format, params object[] parameters);

// Writes an information message to the trace. This method is provided for optimal performance when
// tracing simple messages which don't require a format string.
void TraceInfo(string message);

// Writes an information message to the trace. This method is intended to be used when the data that needs to be
// written to the trace is expensive to be fetched. The method represented by the Func<T> delegate will only be invoked if
// tracing is enabled.
void TraceInfo(Func<string> expensiveDataProvider);

// Writes a warning message to the trace.
void TraceWarning(string format, params object[] parameters);

// Writes a warning message to the trace. This method is provided for optimal performance when
// tracing simple messages which don't require a format string.
void TraceWarning(string message);

// Writes a message to the trace. This method can be used to trace detailed information
// which is only required in particular cases.
void TraceDetails(string format, params object[] parameters);

// Writes an error message to the trace.
void TraceError(string format, params object[] parameters);

// Writes an error message to the trace. This method is provided for optimal performance when
// tracing simple messages which don't require a format string.
void TraceError(string message);

// Writes the exception details to the trace.
void TraceError(Exception ex);

// Writes the exception details to the trace.
void TraceError(Exception ex, bool includeStackTrace);

// Writes the exception details to the trace.
void TraceError(Exception ex, bool includeStackTrace, Guid callToken);

// Writes an informational event into the trace log indicating that a method is invoked. This can be useful for tracing method calls to help analyze the
// code execution flow. The method will also write the same event into default System.Diagnostics trace listener, however this will only occur in the DEBUG code.
// A call to the TraceIn method would typically be at the very beginning of an instrumented code.
Guid TraceIn(params object[] inParameters);

// Writes an informational event into the trace log indicating that a method is invoked. This can be useful for tracing method calls to help analyze the
// code execution flow. The method will also write the same event into default System.Diagnostics trace listener, however this will only occur in the DEBUG code.
// A call to the TraceIn method would typically be at the very beginning of an instrumented code.
// This method is provided to ensure optimal performance when no parameters are required to be traced.
Guid TraceIn();

// Writes an informational event into the trace log indicating that a method is about to complete. This can be useful for tracing method calls to help analyze the
// code execution flow. The method will also write the same event into default System.Diagnostics trace listener, however this will only occur in the DEBUG code.
// A call to the TraceOut method would typically be at the very end of an instrumented code, before the code returns its result (if any).
void TraceOut(params object[] outParameters);

// Writes an informational event into the trace log indicating that a method is about to complete. This can be useful for tracing method calls to help analyze the
// code execution flow. The method will also write the same event into default System.Diagnostics trace listener, however this will only occur in the DEBUG code.
// A call to the TraceOut method would typically be at the very end of an instrumented code, before the code returns its result (if any).
// This method is provided to ensure optimal performance when no parameters are required to be traced.
void TraceOut();

// Writes an informational event into the trace log indicating that a method is about to complete. This can be useful for tracing method calls to help analyze the
// code execution flow. The method will also write the same event into default System.Diagnostics trace listener, however this will only occur in the DEBUG code.
// A call to the TraceOut method would typically be at the very end of an instrumented code, before the code returns its result (if any).
void TraceOut(Guid callToken, params object[] outParameters);

// Writes an informational event into the trace log indicating a start of a scope for which duration will be measured.
long TraceStartScope(string scope, params object[] parameters);

// Writes an informational event into the trace log indicating the start of a scope for which duration will be measured.
// This method is provided in order to ensure optimal performance when no parameters are available for tracing.
long TraceStartScope(string scope);

// Writes an informational event into the trace log indicating the start of a scope for which duration will be measured.
// This method is provided in order to ensure optimal performance when only 1 parameter of type Guid is available for tracing.
long TraceStartScope(string scope, Guid callToken);

// Writes an informational event into the trace log indicating the end of a scope for which duration will be measured.
void TraceEndScope(string scope, long startTicks);

// Writes an informational event into the trace log indicating the end of a scope for which duration will be measured.
void TraceEndScope(string scope, long startTicks, Guid callToken);
We implemented the ability to support instrumentation by a component type so that tracing can be enabled and disabled separately for custom pipeline components, orchestrations, maps, rules and so on. The TraceManager class exposes a static instance of ComponentTraceProvider for each individual type of components as follows:
 /// The main tracing component which is intended to be invoked from user code.
public static class TraceManager
{
    #region Private members
    private static IComponentTraceProvider pipelineComponentTracer = new ComponentTraceProvider("PipelineComponent", new Guid("691CB4CB-D20C-408e-8CFF-FD8A01CD2F75"));
    private static IComponentTraceProvider workflowComponentTracer = new ComponentTraceProvider("WorkflowComponent", new Guid("D2316AFB-414B-42e4-BB7F-3AA92B96A98A"));
    private static IComponentTraceProvider dataAccessComponentTracer = new ComponentTraceProvider("DataAccessComponent", new Guid("2E5D65D8-71F9-43e9-B477-733EF6212895"));
    private static IComponentTraceProvider transformComponentTracer = new ComponentTraceProvider("TransformComponent", new Guid("226445A8-5AF3-4dbe-86D2-73E9B965378E"));
    private static IComponentTraceProvider serviceComponentTracer = new ComponentTraceProvider("ServiceComponent", new Guid("E67E8346-90F1-408b-AF40-222B6E3C5ED6"));
    private static IComponentTraceProvider customComponentTracer = new ComponentTraceProvider("CustomComponent", new Guid("6A223DEA-F806-4523-BAD0-312DCC4F63F9"));
    private static IComponentTraceProvider rulesComponentTracer = new ComponentTraceProvider("RulesComponent", new Guid("78E2D466-590F-4991-9287-3F00BA62793D"));
    private static IComponentTraceProvider trackingComponentTracer = new ComponentTraceProvider("TrackingComponent", new Guid("5CBD8BA0-60F8-401b-8FF5-C7F3D5FABE41"));
    #endregion

    #region Public properties
    // The trace provider for user code in the custom pipeline components.
    public static IComponentTraceProvider PipelineComponent
    {
        get { return pipelineComponentTracer; }
    }

    // The trace provider for user code in workflows (such as expression shapes in the BizTalk orchestrations).
    public static IComponentTraceProvider WorkflowComponent
    {
        get { return workflowComponentTracer; }
    }

    // The trace provider for user code in the custom components responsible for data access operations.
    public static IComponentTraceProvider DataAccessComponent
    {
        get { return dataAccessComponentTracer; }
    }

    // The trace provider for user code in the transformation components (such as scripting functoids in the BizTalk maps).
    public static IComponentTraceProvider TransformComponent
    {
        get { return transformComponentTracer; }
    }

    // The trace provider for user code in the service components (such as Web Service, WCF Service or service proxy components).
    public static IComponentTraceProvider ServiceComponent
    {
        get { return serviceComponentTracer; }
    }

    // The trace provider for user code in the Business Rules components (such as custom fact retrievers, policy executors).
    public static IComponentTraceProvider RulesComponent
    {
        get { return rulesComponentTracer; }
    }

    // The trace provider for user code in the business activity tracking components (such as BAM activities).
    public static IComponentTraceProvider TrackingComponent
    {
        get { return trackingComponentTracer; }
    }

    // The trace provider for user code in any other custom components which don't fall into any of the standard categories such as Pipeline, Workflow, DataAccess, Transform, Service or Rules.
    public static IComponentTraceProvider CustomComponent
    {
        get { return customComponentTracer; }
    }
    #endregion
}
The new tracing framework has delivered the following benefits:
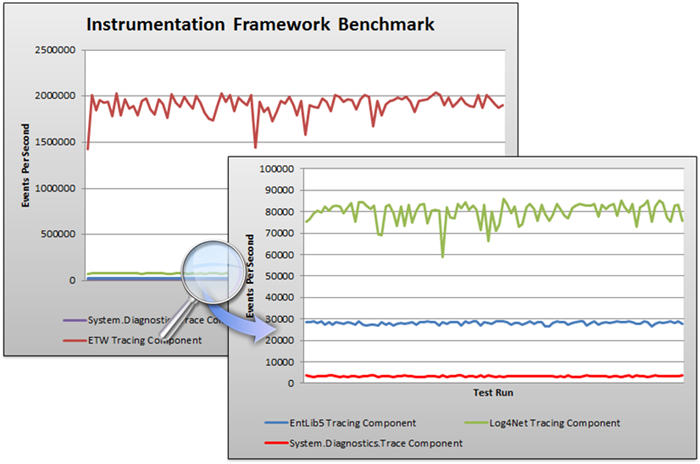
- Highest possible performance – our tests on a 3.2GHz Quad Core machine have proven that ETW-based tracing component is able to write about 1.4 million trace events per second;
- No high CPU utilization observed whenever trace events are persisted into a log file. ETW is using a buffering and logging mechanism implemented in the kernel. The logging mechanism uses per-processor buffers that are written to disk by an asynchronous writer thread. This significantly reduces the impact of the log write operations on the application and system performance.
- Full operational flexibility enables switching the tracing on and off as well as changing the trace level dynamically, making it easy to perform detailed tracing in production environments without requiring reboots or application restarts.
- Tracing can be safely enabled to run continuously in a production environment using the circular logging option which ensures that log files will not outgrow the available disk space.
Performance Considerations
When compared to the other 3 popular rivals (System.Diagnostic.Trace in the .NET Framework, log4net and Enterprise Library), the ETW-based implementation has demonstrated a significantly better performance. In order to measure the true extent of performance benefits delivered by the ETW-based component, we have created a fairly simple test scenario.
In our test case, we executed 1 instrumented method 100,000 times writing 1 trace event in each iteration. To make it fair for everyone, we configured all 4 benchmarked instrumentation frameworks to produce a text-based trace log file at the end of the test run.
Below are the results from our benchmarking exercise:

The code samples include a test tool which was used for benchmarking all 4 instrumentation frameworks.
Usage Patterns
The examples below illustrate the usage pattern for the tracing framework. This code fragment demonstrates the use of the TraceManager component for capturing 2 events indicating when method was invoked (TraceIn) and when it was completed (TraceOut).
 public void BeginAndCompleteActivity(ActivityBase activity)
{
    Guard.ArgumentNotNull(activity, "activity");

    var callToken = TraceManager.TrackingComponent.TraceIn(activity.ActivityName, activity.ActivityID);

    this.eventStream.BeginActivity(activity.ActivityName, activity.ActivityID);
    this.eventStream.UpdateActivity(activity.ActivityName, activity.ActivityID, ActivityTrackingUtility.GetActivityData(activity));
    this.eventStream.EndActivity(activity.ActivityName, activity.ActivityID);

    TraceManager.TrackingComponent.TraceOut(callToken);
}
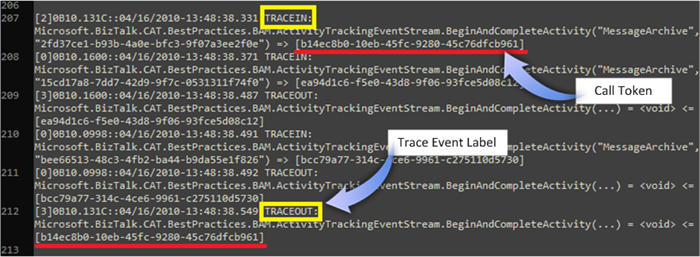
When enabled, the trace log will contain both events written with a timestamp along with a call correlation token (callToken) which enables to match both TraceIn and TraceOut events together:
The following sections drill down into specific instrumentation scenarios across the entire family of artifacts and building blocks in a BizTalk solution.
Instrumentation of Custom Pipeline Components
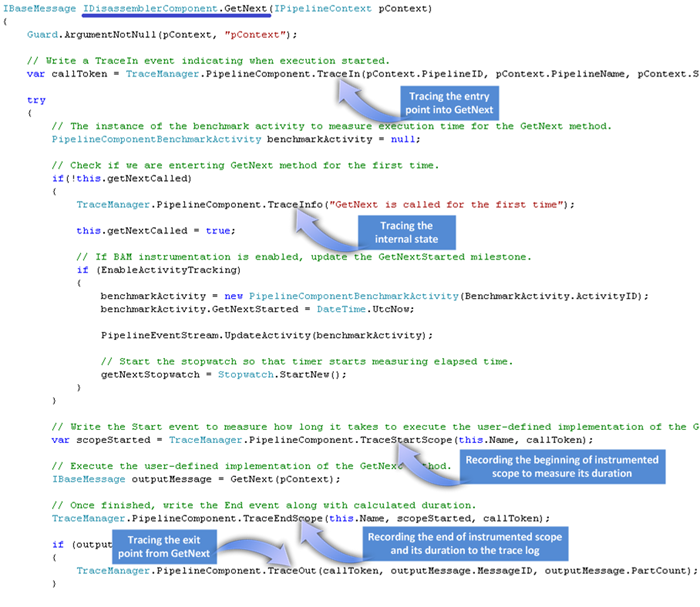
The custom pipeline components can be instrumented using TraceManager.PipelineComponent which is dedicated for this type of BizTalk artifacts. Some of the useful events to be captured through the code instrumentation may include:
- Tracing calls to the core methods such as Execute , Disassemble , GetNext , etc. (using TraceIn and TraceOut);
- Measuring duration of the above methods (using TraceStartScope and TraceEndScope);
- Tracing the internal state of pipeline components which could in turn assist with troubleshooting (using TraceInfo);
- Writing detailed information about a runtime exception (using TraceError).
Below is an example of some of the techniques highlighted above:
Instrumentation of BizTalk Maps
The BizTalk maps can be instrumented using TransformTraceManager component which can be invoked from inside a custom scripting functoid associated with an external assembly. Some useful events that can be captured from the maps when they are being executed by the BizTalk runtime engine may include:
- Tracing the invocation of XSLT templates implementing the BizTalk maps (using TraceIn and TraceOut);
- Tracing the internal state of maps, e.g. the node values which are being transformed, which could in turn assist with troubleshooting (using TraceInfo).
In the example below, the instrumented map is using the TraceInfo method to report the values of the GSxx nodes in the input document:

Note that BizTalk maps cannot invoke static methods from an external assembly by design. Consequently, there is a separate non-static class (TransformTraceManager) that is responsible for relaying method calls between a map and the statically initialized singleton TraceManager.TransformComponent object.
When adding instrumentation into BizTalk maps, it’s important to have the custom scripting functoids linked to appropriate nodes in the output document, otherwise the scripting code will be omitted from the auto-generated XSLT template. In the above example, all scripting functoids are connected to the root node in the output document via a helper Logical OR functoid. This ensures that tracing takes place right before creating the root XML element and results in generating the following XSLT code by the BizTalk mapper:
 <!-- There is some XSLT code before this element -->
<xsl:template match="/s2:CSC_837D">
    <xsl:variable name="var:v1" select="ScriptNS0:TraceInfo(string(s0:Headers/s0:GS/s0:GS01/text()))" />
    <xsl:variable name="var:v2" select="ScriptNS0:TraceInfo(string(s0:Headers/s0:GS/s0:GS02/text()))" />
    <xsl:variable name="var:v3" select="ScriptNS0:TraceInfo(string(s0:Headers/s0:GS/s0:GS03/text()))" />
    <xsl:variable name="var:v4" select="ScriptNS0:TraceInfo(string(s0:Headers/s0:GS/s0:GS04/text()))" />
    <xsl:variable name="var:v5" select="ScriptNS0:TraceInfo(string(s0:Headers/s0:GS/s0:GS05/text()))" />
    <xsl:variable name="var:v6" select="ScriptNS0:TraceInfo(string(s0:Headers/s0:GS/s0:GS06/text()))" />
    <xsl:variable name="var:v7" select="ScriptNS0:TraceInfo(string(s0:Headers/s0:GS/s0:GS07/text()))" />
    <xsl:variable name="var:v8" select="ScriptNS0:TraceInfo(string(s0:Headers/s0:GS/s0: GS08/text()))" />
    <xsl:variable name="var:v9" select="userCSharp:LogicalOr(string($var:v1), ’true’, string($var:v2), string($var:v3), string($var:v4), string($var:v5), string($var:v6), string($var:v7), string($var:v8))" />
    <xsl:if test="$var:v9">
      <ns0:W4880200-COMMON-EDIT-MED-CLAIM>
      <!-- There is plenty of other XSLT code after this element -->
Instrumentation of BizTalk Orchestrations
As BizTalk orchestrations become increasingly complex, the instrumentation is becoming a key factor in helping to diagnose and troubleshoot behavioral problems, performance-related issues and other bottlenecks that were not foreseen or manifested themselves during development.
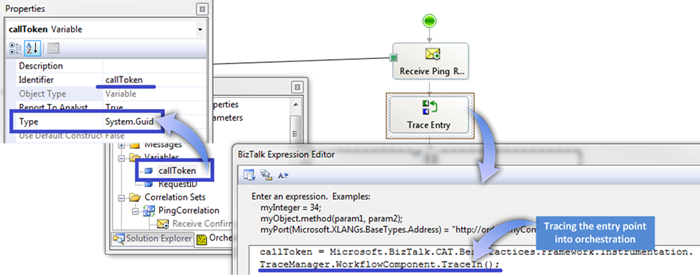
A well instrumented orchestration can be described as follows:
- The entry point into an orchestration is recorded (using TraceIn) immediately or at least at the first available opportunity (e.g. after the very first Receive shape );
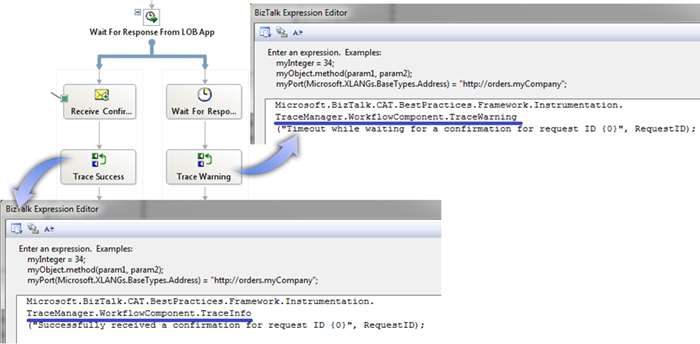
- The internal state of orchestrations (e.g. variables, results from method calls, non-sensitive message payload) is wisely traced (using TraceInfo);
- Unexpected behavior is reported as soon as it is detected (using TraceWarning or TraceError);
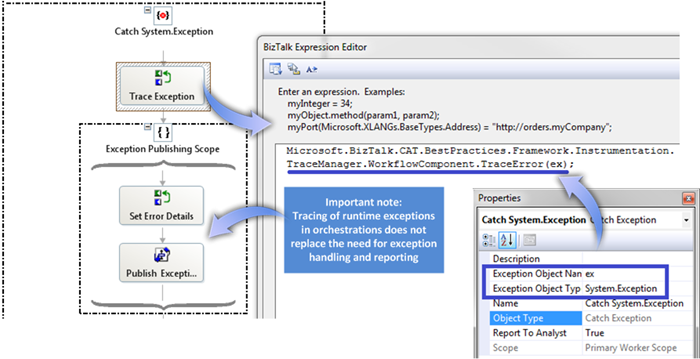
- The detailed information about a runtime exception is traced from inside the exception handling block (using TraceError);
- The duration of individual scopes or/and entire orchestration is measured and traced (using TraceStartScope and TraceEndScope);
- The exit point from an orchestration is recorded (using TraceOut) either right before the Terminate shape or at the very last step in the orchestration.
Below are some example of the instrumentation techniques highlighted above:


Instrumentation of Business Rules
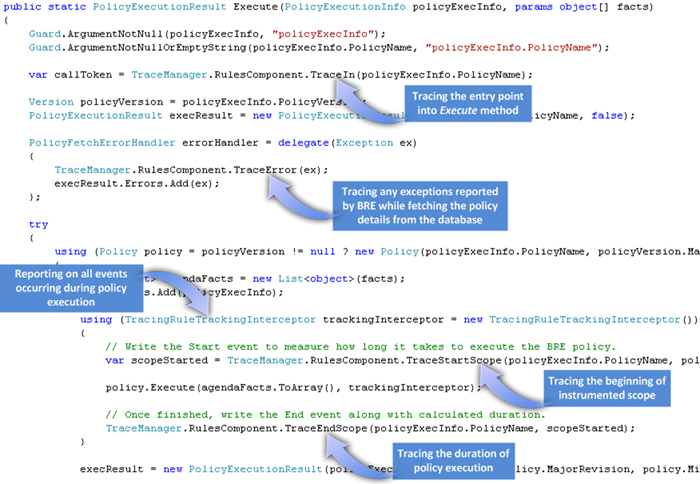
The instrumentation of business rules can be extremely valuable when there is a requirement to understand how rule conditions are being evaluated, what rules are being fired as well as how long it takes to execute a rule set (policy).
A well instrumented business rule policy can be defined as follows:
- All calls to a helper class invoking the BRE APIs (such as Policy objects) are traced (using TraceIn and TraceOut);
- The duration of policy execution is recorded (using TraceStartScope and TraceEndScope);
- The BRE policies are invoked passing an instance of a class implementing the IRuleSetTrackingInterceptor interface - this class should report on all significant events which occur during policy execution;
- Each rule in the policy informs the instrumentation framework that the rules was fired by the BRE engine (using either TraceInfo, TraceWarning or TraceError).
The business rules instrumentation is powered by 3 components in our framework:
- TraceManager.RulesComponent provides general instrumentation methods for all helper .NET components accessing the BRE APIs;
- RuleTraceManager residing in the Microsoft.BizTalk.CAT.BestPractices.Framework.RulesEngine namespace implements a static class which is intended to be used on the Action pane inside the Business Rule Composer. Its main purpose is to expose a set of tracing methods with a fixed parameter list. Internally, the RuleTraceManager is simply proxying all calls to TraceManager.RulesComponent. A requirement for a separate class has arisen from the fact that the Business Rules Engine doesn’t currently support the invocation of methods with a variable number of parameters (also known as parameter arrays);
- TracingRuleTrackingInterceptor which is also available in the Microsoft.BizTalk.CAT.BestPractices.Framework.RulesEngine namespace provides a custom implementation of the IRuleSetTrackingInterceptor interface. All events which occur during policy execution will be traced using TraceManager.RulesComponent.
The following recommendations would apply in the context of business rules instrumentation:
- When calling any static methods from inside the business rules, make sure that StaticSupport parameter is present either in the application’s configuration file (e.g. BTSNTSvc.exe.config) or system registry. Otherwise, the following behavior may be encountered;
- Consider adding a TraceInfo instrumentation event into each individual rule to facilitate the analysis of rule execution without having to analyze all events reported by the Rules Engine through TracingRuleTrackingInterceptor;
- In addition to TraceInfo, TraceWarning and TraceError can be wisely applied at individual rule level in order to report on unexpected fact values or rules that are not expected to have been executed for a given set of facts.
Below are some example of the approaches highlighted above:


Instrumentation of Custom Components
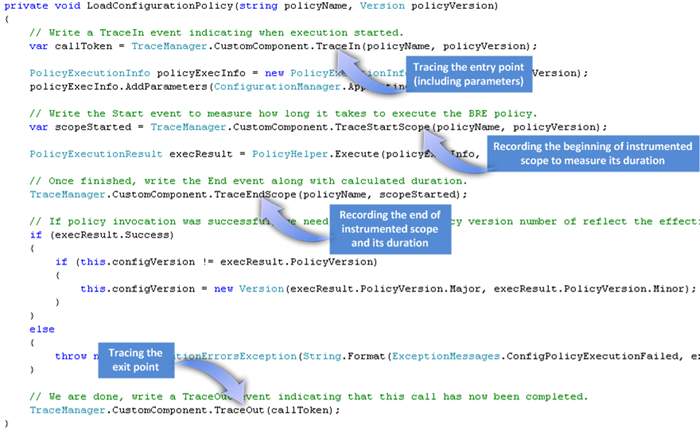
The custom .NET components can be instrumented by invoking the trace methods provided by TraceManager.CustomComponent which enables:
- Method-level instrumentation whereby calls to individual methods are recorded in the trace log with zero or more optional parameters (using TraceIn and TraceOut);
- Measuring duration to be able to capture accurate execution timings (using TraceStartScope and TraceEndScope);
- Tracing the internal state of custom components which could in turn assist with troubleshooting (using TraceInfo or TraceWarning);
- Writing detailed information about a runtime exception (using TraceError).
Below is an example of some of the techniques highlighted above:
Show me the code! You can find the source code in the attachment below. Please share your feedback to help improve the instrumentation samples.
Best Practices for Instrumenting High Performance BizTalk Solutions.zip
For more information on the related topic, please visit the following resources:
- “Improve Debugging And Performance Tuning With ETW” article in the MSDN Magazine
- “Intro to Event Tracing For Windows” post on Matt Pietrek’s blog
Comments
- Anonymous
October 26, 2010
The comment has been removed - Anonymous
October 27, 2010
Thanks for letting us know. The download link has now been updated. - Anonymous
November 23, 2010
The comment has been removed - Anonymous
November 25, 2010
Would appreciate if you could provide some more details on how you start a trace session and whether or not you can see the logged error message in DebugView (provided your code is compiled in DEBUG mode). - Anonymous
February 16, 2011
I was not able to get the BizTalk Solution Instrumentation Framework v1.4 to compile on a machine with Visual Studio 2010 Premium and BizTalk 2010. Am I doing something wrong, or is this only for Visual Studio 2008 and BizTalk 2009? - Anonymous
February 16, 2011
It would be helpful if you can supply the error message that you get. - Anonymous
February 21, 2011
I had to remove the "Tests" project from the solution because I only have the "Premium" version of VS 2010, and it apparently doesn't have the LoadTestFramework.dll.Then I had to switch both projects over to target Framework 3.5 because there were a ton of errors about types or namespaces not existing in "Microsoft.BizTalk" with Framework 2.0 targeted.Now I am getting:C:JunkBizTalk Solution Instrumentation Framework v1.4Microsoft.BizTalk.CAT.BestPractices.Samples.FrameworkInstrumentationComponentTraceProvider.cs(30,25): error CS0535: 'Microsoft.BizTalk.CAT.BestPractices.Framework.Instrumentation.ComponentTraceProvider' does not implement interface member 'Microsoft.BizTalk.CAT.BestPractices.Framework.Instrumentation.IComponentTraceProvider.TraceInfo(Microsoft.BizTalk.CAT.BestPractices.Framework.Func<string>)' - Anonymous
February 21, 2011
If you switch the compiler's target to .NET 3.5 or above, you will need to remove the declaration of Func<T> delegate from FrameworkUtility.cs. Readme.htm includes a comment stating the following:Removed unwanted dependency on .NET 3.5. Note that Func<T> delegate declaration needs to be removed from FrameworkUtility.cs should the sample code be ported into a project with target .NET Framework set to 3.5 or above.Trust this should help. - Anonymous
March 10, 2011
Great Post! , I guess the link for source code download is broken . Can you please enable it again - Anonymous
March 12, 2011
I just verified the link, it is in a perfect shape :-) Please try again.All our samples can be found on the MSDN Code Gallery: code.msdn.microsoft.com/appfabriccat - Anonymous
November 05, 2012
Hi, Even after implementing the whole framework, I am not able to see any Logging in the events.Kindly help!!!