My Take on an Azure Open Source Cross-Platform DevOps Toolkit–Part 4
| My Take on an Azure Open Source Cross-Platform DevOps Toolkit–Part 1 | Click Here |
| My Take on an Azure Open Source Cross-Platform DevOps Toolkit–Part 2 | Click Here |
| My Take on an Azure Open Source Cross-Platform DevOps Toolkit–Part 3 | Click Here |
| My Take on an Azure Open Source Cross-Platform DevOps Toolkit–Part 4 | Click Here |
| My Take on an Azure Open Source Cross-Platform DevOps Toolkit–Part 5 | Click Here |
| My Take on an Azure Open Source Cross-Platform DevOps Toolkit–Part 6 | Click Here |
| My Take on an Azure Open Source Cross-Platform DevOps Toolkit–Part 7 | Click Here |
| My Take on an Azure Open Source Cross-Platform DevOps Toolkit–Part 8 | Click Here |
| My Take on an Azure Open Source Cross-Platform DevOps Toolkit–Part 9 | Click Here |
| My Take on an Azure Open Source Cross-Platform DevOps Toolkit–Part 10 | Click Here |
| My Take on an Azure Open Source Cross-Platform DevOps Toolkit–Part 11 | Click Here |
| My Take on an Azure Open Source Cross-Platform DevOps Toolkit–Part 12 | Click Here |
Outputting the pipeline state throughout the process - the tooling we will need
This is the first of a couple posts around simply interacting with the MySQL database. As explained previously, the purpose of this database is to track state in the pipeline (and display it). So there's a few scripts that help manage this process, written in Python and explained below.
One of the scripts simply clears out the messages table. We needed to do this at the beginning of each pipeline execution.
The other thing we need to do is output the messages table to the Jenkins console output window. It's very important that we display state of the pipeline as it executes so we can figure out where a breakdown might have occurred in the execution of the pipeline.
So this post is all about interacting with MySQL using Python. One of the extra things that I've added extra is some pretty text boxes around the output, so that the pipeline state would stand out in the sea of the messages that you will see in the Jenkins console output window.
We are still in the early stages of constructing our pipeline. We haven't compiled anything at. We haven't tested anything yet.
We are simply building out the tooling's we will used in the rest of the pipeline.
Every Python script in some way interacts with the persistent store (MySQL).
You can see all this in the diagram below.
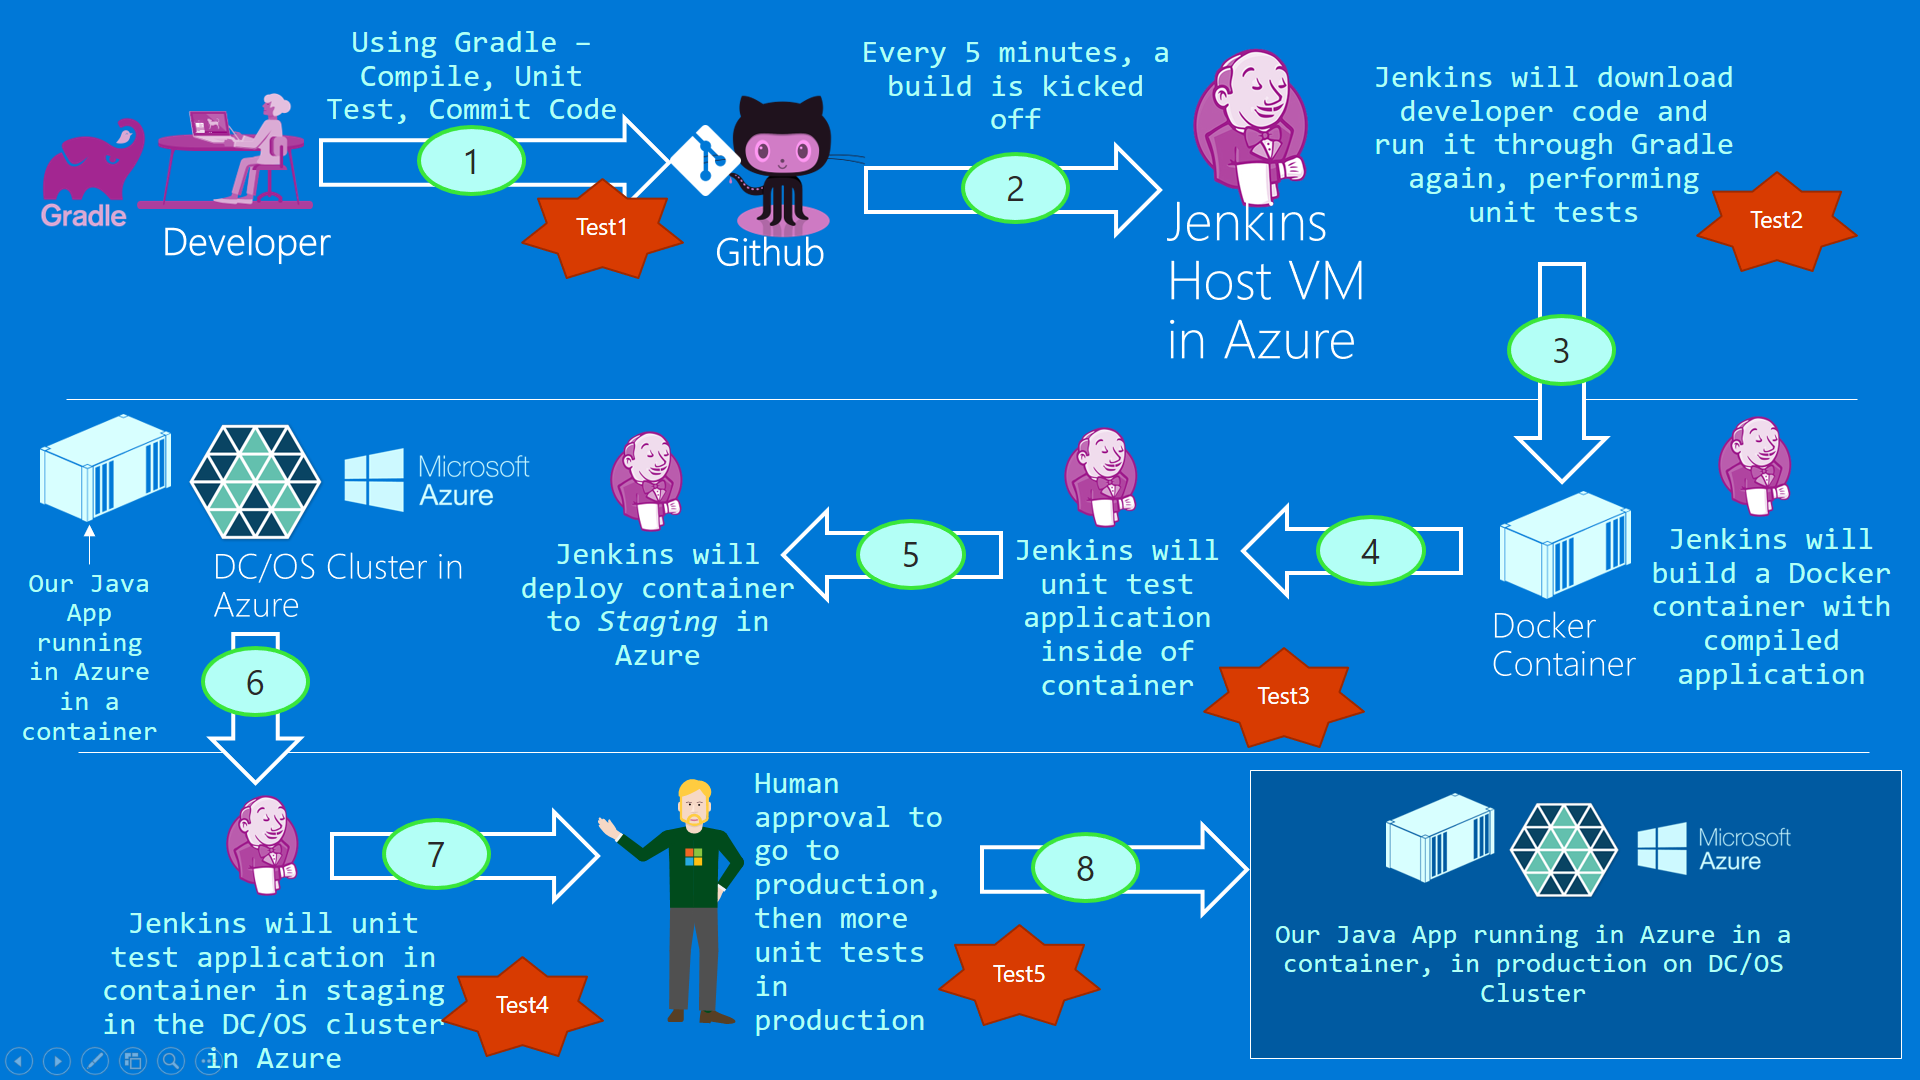
Figure 1: The big picture
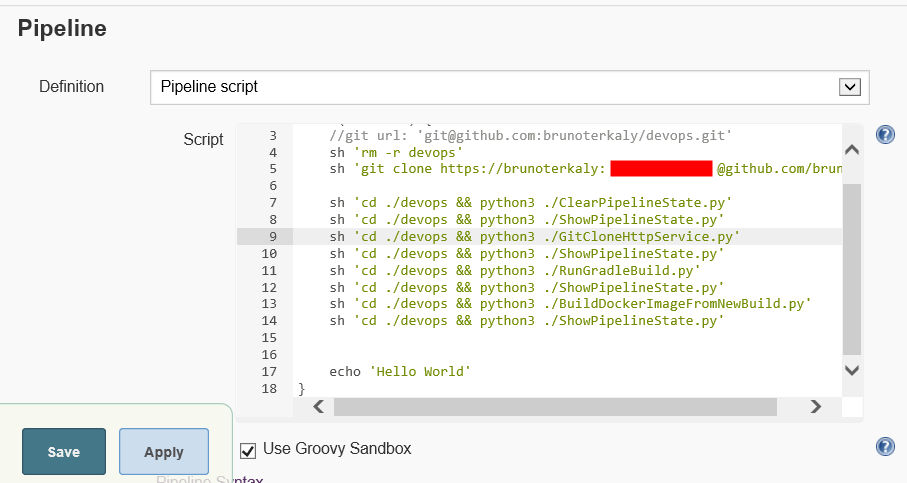
The pipeline as it stands now
Let's quickly walk through some of these lines.
- Line 4
- Cleanup the directory structure from any previous executions of the pipeline
- Line 5
- Download our DevOps toolkit. This includes the docker file and all corresponding Python script.
- Line 7
- This is Python script that will initialize the Jenkins database. The Jenkins database is hosted in a MySQL server. Specifically, we will truncate the messages table.
- Line 8
- ShowPipelineState.py will simply list out the content of the messages table. This is a very important capability because at any point in time we can see the entire state of our pipeline. Notice that we execute the script at the end of each step in the pipeline.
Figure 2: The current state of the pipeline
ClearPipelineState.py
This is a script that executes once at the beginning of the pipeline. The purpose is to clear out any existing messages that might be remaining after the last run of the pipeline. An extension of this capability might be to archive all the previous states
One of the longer term goals I want to explore is analyzing all the output jobs to provide a holistic view of all Jenkins pipeline that may be used in an organization. That's what I am trying to capture this output in some type of structured way, to simplify analysis later.
The code below does something simple. It simply clears out the messages table at the beginning of execution of the pipeline.
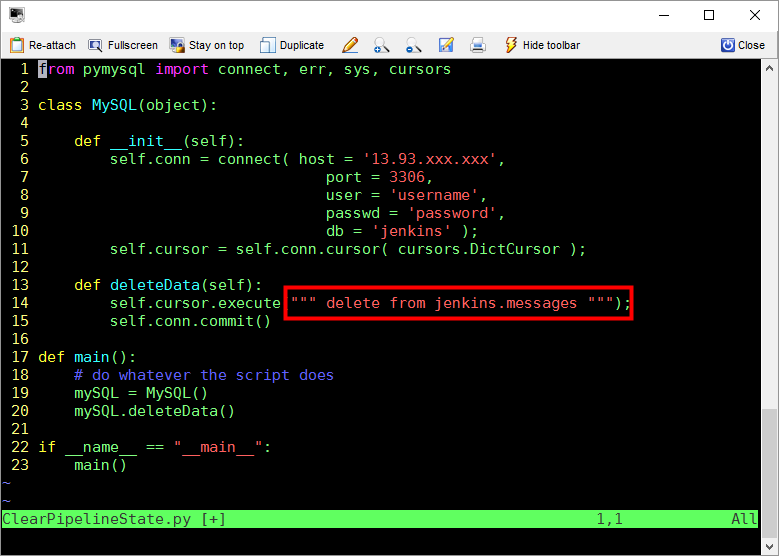
Figure 3: Python code to clear out the messages table
ShowPipelineState.py
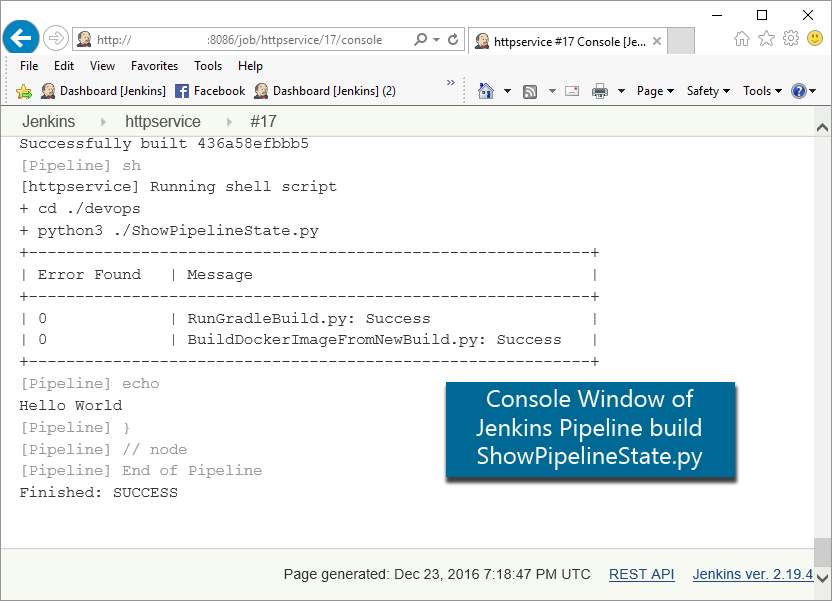
What you are looking at, below is the console output window for my build.
Notice that ShowPipelineBuild.py outputs the contents of the messages table.
Notice the two of the scripts have run with success:
- RunGradelBuild.md
- BuildDockerImageFromNewBuild.md
Figure 4: Displaying the state of the pipeline in the Jenkins console output window
But success will not always be the case. Your unit tests will not always pass.
Notice below that there was a failure in one of the steps of the pipeline.
Subsequent Python scripts in the pipeline need to avoid doing their work if any errors are discovered earlier in the pipeline execution.
Figure 5: Failure in the pipeline be displayed in the Jenkins console output window
Beautifying the output of ShowPipelineState.py
You probably noticed in figures 4 and 5 that the output from the messages table is formatted nicely with a box-like appearance.
I wanted the output to stand out from all the countless other messages being displayed in the Jenkins console output window. The way I achieved that was simply creating an ASCII box around the output. But that required me to write a bit of Python code to figure out how to make it look good, taking into account column width, then generally trying to align it well.
There are a few things you should notice here:
- On lines 1 and 2 we bring in the necessary packages (pymysql and sortedcontainers)
- pymysql may require you to do a "pip install..." command at the console of the Jenkins host
- The method called showData() does all the heavy lifting around calculating column width as well. as well as adding the necessary ASCII characters to create the illusion of a box
There is probably more elegant ways to do what I'm doing but this is working well for a simple solution.
I tried to use some third-party packages to do this, but trying to figure out how they work seemed like more effort than it was worth, compared to just doing something simple for myself.
I did waste some time trying to figure out why the columns coming back from a query change ordered randomly. That's why you see line 23 using a sorted dictionary to make sure that I control column order.
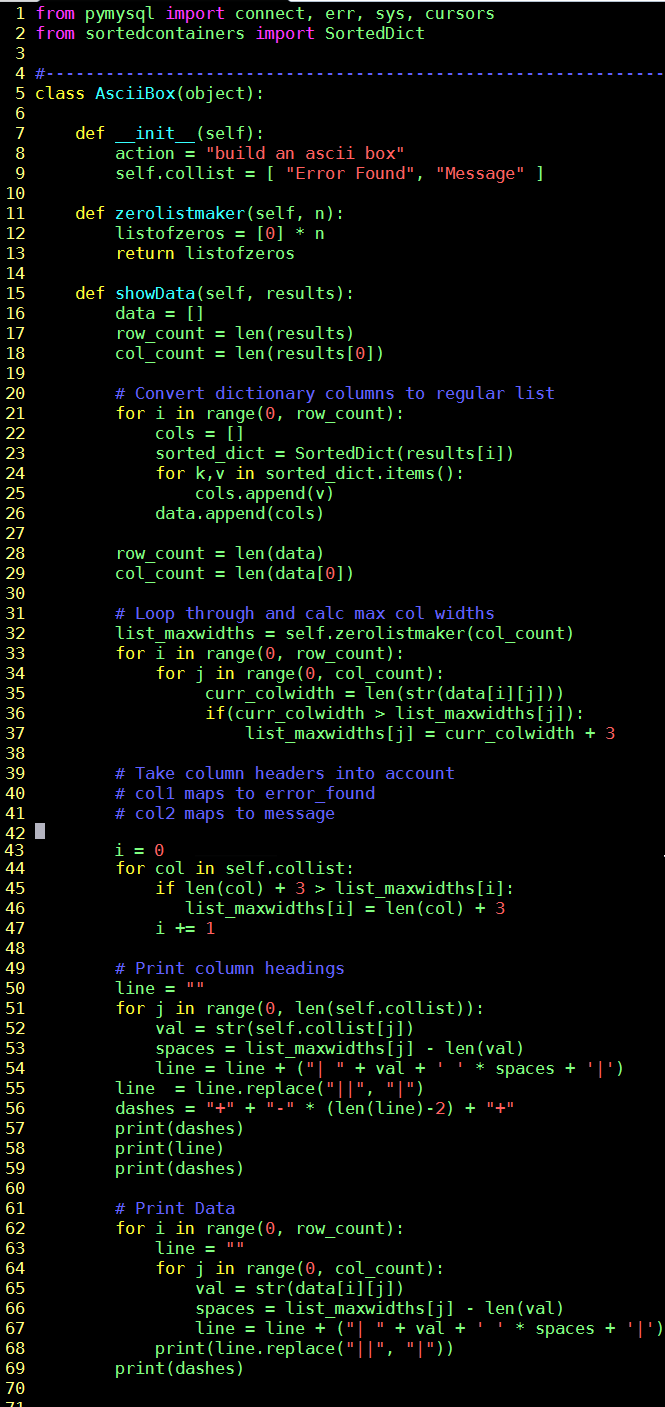
Figure 6: ShowPipelineState.py and class AsciiBox
The rest of ShowPipelineState.py
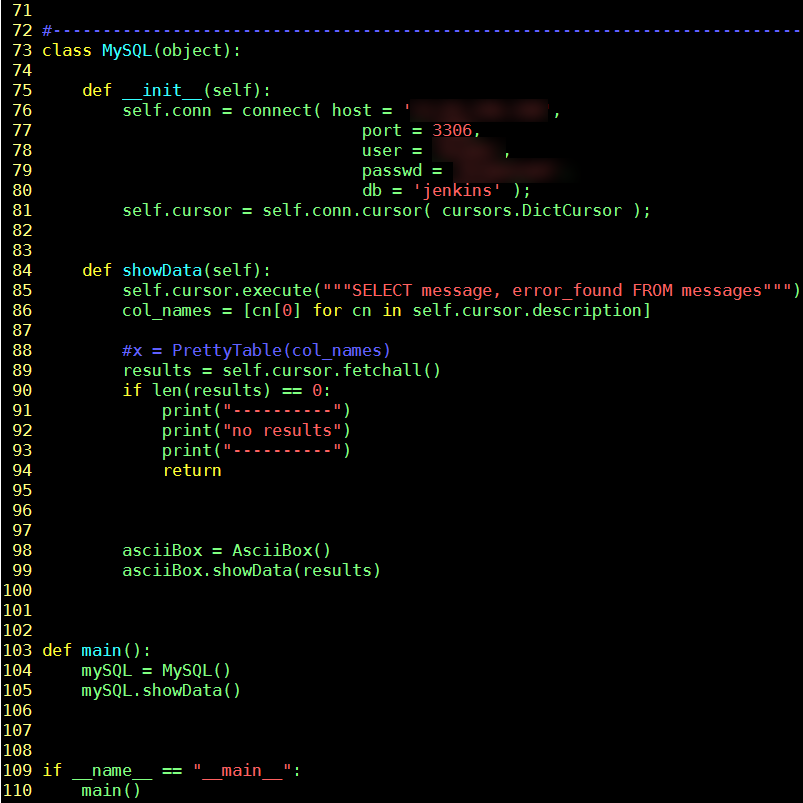
The next chunk of code is more about the real work of selecting from the messages table and then telling the class above to do the work of showing it formatted.
Figure 7: Outputting data from ShowPipelineState.py
Conclusion
We are halfway through building some of the tooling we will need. We are spending some time up front to define the code that interacts with the persistent state store that tracks pipeline execution.
MySQL plays a crucial role in tracking state of execution in the pipeline. All the scripts in the pipeline interact with it to track the execution of the pipeline accurately and in a centrally managed fashion.
