Reporting Progress
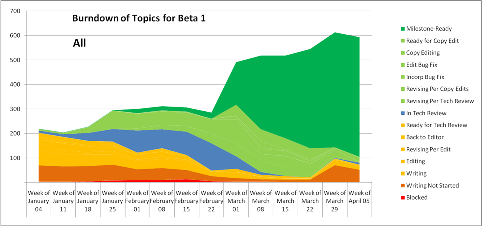
Since we mirror our topics from our content management system into TFS, we're able to use the TFS warehouse and Excel to easily create reports like this chart.
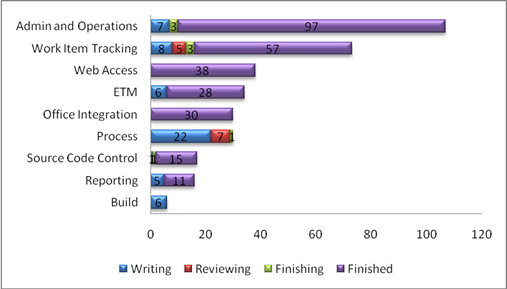
We also link the topics to the the deliverables that describe the work that the product unit is doing. That lets us create charts that show progress by the area of the product, like this.
Each of these took just a few minutes to create using Excel and the techniques described in How to: Create a Report in Microsoft Excel. Now, we just refresh the report in Excel (Data menu, Refresh All) to see the current status.
Comments
- Anonymous
May 14, 2009
PingBack from http://microsoft-sharepoint.simplynetdev.com/reporting-progress/

