Under the hood of your browser
If you want to understand what's going on behind the scenes when ad space is bought and sold and ads displayed on the Internet, it's important to know about the background processes that occur when browsers are running. This page contains information about tools that will help you access and understand that activity.
Ghostery
Let's say you visit the website swap-bot.com, which organizes swaps of crafts and other items among users of the site. (Full disclosure: swap-bot.com is a side project of a former Xandr engineer and his wife.) You type swap-bot.com into your browser's address bar, and your browser starts downloading content from a swap-bot.com server somewhere. But, as your page is loading, your browser also starts passing information and requests to other sites and servers, such as DoubleClick, Quantcast, Google Analytics, and others. (To those in the ad tech industry, when a browser sends information and makes requests, it's known as "making calls" or "calling" servers.) How would you know this? And what are those calls for?
There are several great (and free!) tools that can teach you more about what's going on behind the scenes of your Internet activity, such as Ghostery a plugin that you can easily add to any major browser. When you visit a webpage, Ghostery tells you via a little box in the right hand corner of the page what calls are being made in conjunction with this page.

Pixels, beacons, trackers, oh my
In the above example, DoubleClick, Adsense, Project Wonderful, and Rocket Fuel are all ad serving companies, which swap-bot.com uses to figure out the right ads to put on their pages. The calls being made are
generated by ad tags and they are requesting an ad to be shown in a specific slot on the page.
The other calls, Comscore Beacon, Google Analytics, and Quantcast, don't result in content being placed on the page. This type of call has a variety of names, including pixel, web bug, tracker, and beacon. A pixel's goal is to send information about your browser's activity to a system other than the one you are directly contacting, without making any perceptible change to the page.
Pixels are commonly used to help the publisher of the website see what kind of traffic they're getting using a web analytics product such as Google Analytics; your browser "pings" Google Analytics every time it
loads a swap-bot.com page and GA can later tell you that there were 1000 page loads a day from 500 different browsers. It can tell which swap page is the most popular, or what search terms led people to the site,
or how much traffic comes through RSS feeds. Swap-bot.com also has pixels for Quantcast and Comscore, which collect traffic information which advertisers can use to decide where to display ads.
Ghostery may not show a 100% complete picture of the activity that happens when you visit a page. A site could be contacting another system server-side without going through the browser. But it's a strong start and a nice way to see what companies are out there.
A note on privacy: These calls don't happen without the cooperation of the website you are visiting. The webmaster had to place the pixel on the page. Read our privacy policy for a full explanation of what information websites use Xandr's technology to collect, and how it's protected.
Digging deeper: debuggers
If you want to get even more information about browser calls, you can use one of several debugging tools that show and analyze your browser traffic. Debuggers will help you if you're tracking down something specific, like why a pixel isn't firing properly.
Here are a few debuggers:
| Firefox | Chrome | Windows only; all browsers |
|---|---|---|
| Firebug, mainly for Firefox, is not only a debugger, it also provides enriched "inspect element" functions that show you source html, css, etc, and does a few other things, too. | Built-in Developer Tools | Fiddler |
View a webpage's source code
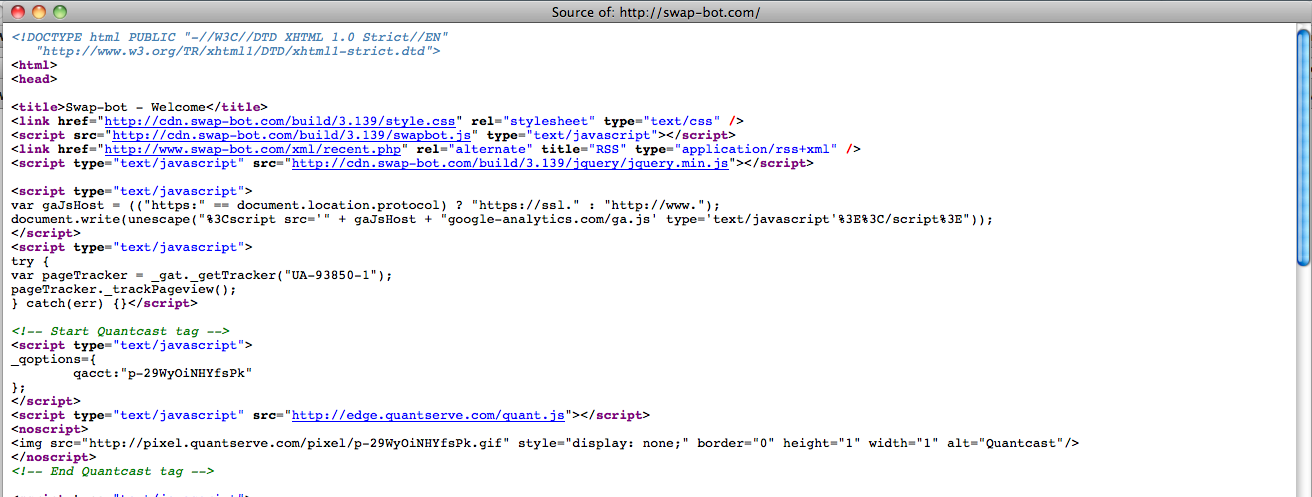
For any website you visit, it's possible to see the HTML and JavaScript code that your browser executes, causing content to show up in your screen, and causing the first round of calls described above. For example, if you go to swap-bot.com using Firefox, and right-click on the page, you'll see an option called "page source." This option shows the below (truncated) code. You'll notice the Quantcast pixel that Ghostery alerted us to above.

Charles web debugging proxy
It's not always easy in web and Internet development to know where exactly something went wrong. Tools such as Charles Web Debugging Proxyacts as an intermediary between your web browser (such as Internet Explorer, Chrome, Safari) and the Internet. You can install it on your computer, and your web browser can then be configured to access theInternet through the Charles Web Debugging Proxy. This is useful because it records all of the data that is sent and received, making it easier to know exactly what is happening, especially when trying to diagnose and troubleshoot an issue.
Summary
When you have an understanding of the available tools and background processes that browsers incorporate to monitor, track, and report on ad serving activity – it allows you to better select the appropriate tools and methods for your specific need. This ultimately equates to improved ad targeting and increased revenue.