Interaction Viewer
Message Analyzer provides the Interaction diagram, which is currently a preview feature. If you wish to use the Interaction viewer, you will need to select its check box on the Features tab of the Options dialog, which is accessible from the global Tools menu, and then restart Message Analyzer. It will then be available for selection in the New Viewer drop-down list on the global Message Analyzer toolbar.
Understanding the Interaction Diagram
The Interaction diagram is an alternate data visualizer that you can select when analyzing your message data. The Interaction diagram provides several viewer formats with different graphic presentations of the computer nodes and endpoints that exchanged messages within the time boundaries of a trace. It also specifies the IP address of the corresponding source and destination nodes or endpoints. The IP communications between source and destination nodes are depicted in the following viewer formats:
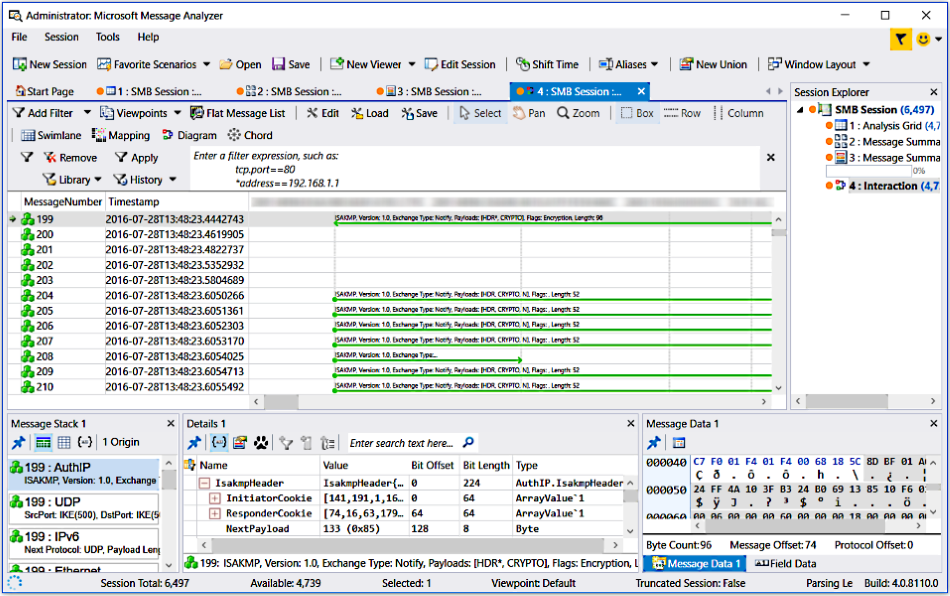
Swimlane — the default viewer format that displays when you launch the Interaction viewer. Displays the IP communications as rows or lines that interconnect source and destination nodes. MessageNumber and Timestamp data is included for identifying messages and the time of capture.
Mapping — provides a mapped graphic presentation that displays color-coded boxes at the intersection of source IP addresses on the X-axis with destination IP addresses on the Y-axis.
Diagram — shows source and destination interactions as lines that are connected between blue colored nodes that vary in thickness, depending on the number of messages they represent. Diagnosis error or informational icons display over connecting lines where errors occurred. IP addresses, protocol types, message count, and/or diagnosis types display when hovering over connection lines or nodes.
Chord — provides a circular display of IP addresses with interconnecting lines between source and destination nodes in the center of the display. Hovering over an interconnecting line causes an informational tooltip to display while all other lines disappear. The tooltip provides the number of selected items, source and destination IP addresses, and the number of messages associated with each interaction.
The figure that follows shows the Interaction viewer in the Swimlane configuration.

Figure 47: Interaction viewer with Swimlane diagram
You can use the features of the Interaction diagram to highlight the communication paths between nodes within the time boundaries of a trace and to identify the relative time within trace boundaries in which network conversations took place. For example, you might use the Interaction diagram to expose a map of communications between IP address nodes to identify a busy server, by observing which node is exchanging the most network traffic. You can also observe the direction of traffic flow between nodes.
Select mode — provides the Box, Row, and Column selection formats for viewing data.
Zoom — enables you to zoom into areas in the data display of specific interest.
Using the Toolbar Commands
The Interaction diagram provides a toolbar with the following commands, which enable you to perform the indicated tasks:
Edit — click this button to open the Swimlane Configuration Editor. Enables you to modify the data display by using the Field Chooser. For example, you could add ModuleName and/or ProcessId fields from the Global Properties node of Field Chooser for Source computers to include this information in the column labels of the Swimlane diagram, to enhance your analysis process.
Load — enables you to load data into the current Interaction viewer display from a previously saved Interaction diagram file in *.maidconfig format.
Save — enables you to save data from the current Interaction viewer display to a *.maidconfig file.
Select mode — not configurable. Defaults to the Box style selection mode.
Pan — not used.
Zoom mode — not used.
The Mapping, Diagram, and Chord viewer formats provide the following additional toolbar items, which are further described in the Gantt Viewer topic:
Using the Context Menu Commands
The Interaction diagram provides two different right-click context menus that display, depending on the Interaction viewer format that you select. The context menus appear when you right-click anywhere on a diagram surface. The context menu contains the following commands that perform the indicated operations:
Swimlane viewer format — the context menu commands in this viewer format consist of the following:
Increase Font — enables you to incrementally increase the size of the diagram display font with each successive selection of this command.
Decrease Font — enables you to incrementally decrease the size of the diagram display font with each successive selection of this command.
Show Multiline Headers — enables the display of all lines of text for multiline headers.
Open Selected Messages — enables you to display one or more selected messages from the Interaction diagram in the Analysis Grid for further analysis, for instance, to add a view Filter and/or group the messages.
Mapping, Diagram, and Chord viewer formats — the context menu commands in these viewer formats consist of the following:
Mouse Mode — contains a submenu with the Select and Zoom options to enable you to change the actions that occur when you click your mouse in the analysis surface. One of these options will always be selected. The Select mode facilitates the selection and processing of messages, while the Zoom mode initiates zooming action when you click in the analysis surface.
Selection Mode — provides a submenu that has the following options that you can use as indicated:
Box — sets the selection mode to the box shape for selecting one or more messages nodes.
Row — sets the selection mode to enable you to select messages in row orientation.
Column — sets the section mode to enable you to select messages in column orientation.
Zoom — contains a submenu that provides several zooming presets that enable you to alter the data presentation to focus on one or more messages.
Settings — contains a submenu that enables you to change the data presentation format by alternately enabling or disabling various chart elements that include Fixed Grid, Auto Scroll, and Display Limit settings.