Moving Annual Total (MAT) (Power BI Report)
APPLIES TO: Generally available in Business Central 2024 release wave 2 (version 25.1).
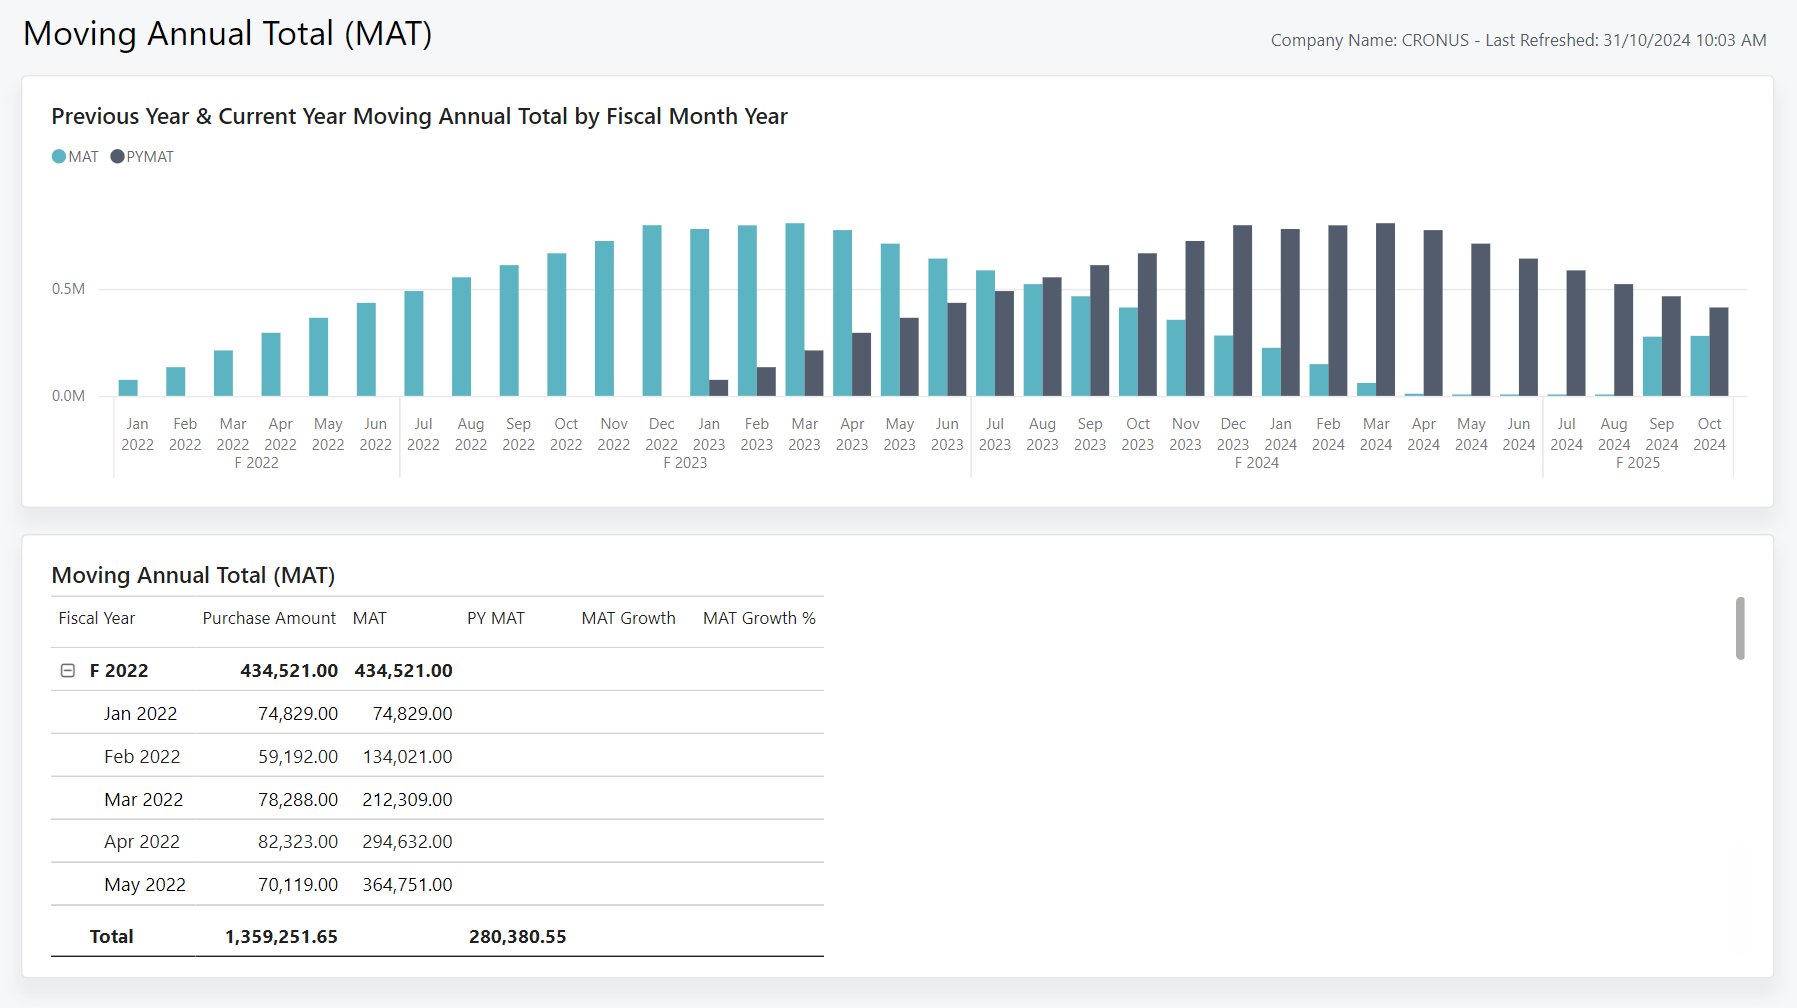
The Moving Annual Total (MAT) report calculates total purchases over the last 12 months. It's a rolling calculation where the date is always moving. This report showcases figures for the Moving Annual Total (MAT) and Previous Year Moving Annual Total (PYMAT).
Use the report
The report is ideal for business leaders and purchasing managers who need to monitor purchase performance in the last 12 months.
CEOs can use the report to monitor the overall purchasing performance over the last 12 months. You can analyze the figures for Moving Annual Total (MAT) and Previous Year Moving Annual Total (PYMAT) and identify trends in purchasing amounts in line with the company's growth. If your purchasing amount exceeds your growth rate, you can use this information to develop a strategic plan that focuses on reducing inventory costs or optimizing purchasing budget. The report can also help you identify periods of high purchasing costs and work with purchasing managers to reduce them.
Purchasing managers can use this report to analyze the purchasing data over the last 12 months, and analyze purchase amounts for specific periods. You can identify purchasing performance by analyzing the MAT growth and growth percentage in each month. These measures offer insight into how your team performs during each period. By identifying the areas where purchasing increased, you can take necessary actions to optimize the purchasing process and ensure you're using purchasing budget efficiently.
Key Performance Indicators (KPIs)
The Moving Annual Total (MAT) report includes the following KPIs and measures:
- Moving Annual Total (MAT)
- Previous Year Moving Annual Total (PYMAT)
- Moving Annual Total Growth Amount
- Moving Annual Total Growth %
- Purchase Amount
Click on the link for a KPI to learn more about what it means, how it is calculated, and what data was used in the calculations.
Tip
You can easily track the KPIs that the Power BI reports display against your business objectives. To learn more, go to Track your business KPIs with Power BI metrics.
Data used in the report
The report uses data from the following tables in Business Central:
- Value Entry
- Purchase Line
Try the report
Try the report here: Moving Annual Total (MAT)
Tip
If you hold down the CTRL key while you select the report link, the report opens on a new browser tab. In this way, you can stay on the current page while you explore the report on the other browser tab.
See also
Track KPIs with Power BI metrics
Power BI Purchasing app
Ad hoc analysis of purchasing data
Built-in purchasing reports
Purchasing analytics overview
Purchasing overview
