OpsMgr: Sample Dashboard with Contextual Monitor State Tiles
:-) :-D -_- :-( :-O d(-_-)b @_@ (\(^o^)/) ^_^ O_O -_-‘’’ ;-) o_O O_o
This article features a sample summary dashboard with Monitor State Tiles from the Microsoft SQL Server Visualization Library (Version 6.5.1.0), that arrange themselves to a preconfigured pattern to match the Health State of the object selected in a State Widget in the same dashboard layout.
Like the Contextual Image Widgets in Sample 1 and Sample 2, the PowerShellDataSource Component is used again. This time to provide positional information to the cells containing the Monitor State Tiles to move them to a specific location based on the Health State of the object selected in the State Widget.
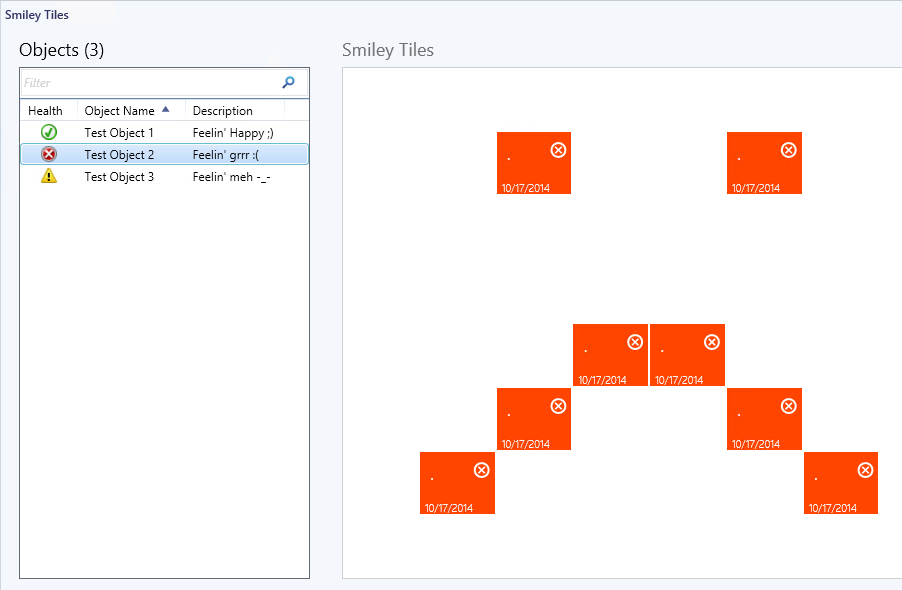
Here is a mapping between the object health state and the arrangement plus the colour display of the Monitor State Tiles.

The management pack containing the sample summary dashboard also consist of a class definition of test objects to display and a discovery rule to create the test objects (instances of the class of test objects). The State Widget is targeted at the test objects class and hence displays all the instances of the class. A VB script based monitor is targeted at the class of test objects to manipulate the health states of the instances based on a keyword in their description property.
Before importing the sample management pack (XML), please note the following:
- ONLY apply and test the sample management pack in a TEST ENVIRONMENT as it creates test objects to be displayed on the State Widget for the purpose of demonstration only.
- The discovery rule only targets the single instance RMS Emulator class, so as to ensure it does not ‘spread’ to other agents.
- Delete the management pack from the Administration pane to remove the sample dashboard and clean up the test objects.
- Update Rollup 2 and above for System Center 2012 R2 Operations Manager is required.
- The Microsoft.SQLServer.Visualization.Library (Version 6.5.1.0) must be imported for the Monitor State Tile components to work.
- You can download this sample management pack bundle from the TechNet Gallery.
To implement the sample summary dashboard:
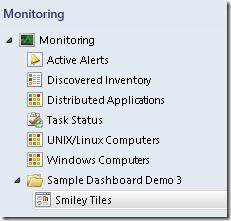
Import the management pack (Sample Summary Dashboard with Contextual Monitor Tiles) –> Close and ReOpen the Operations Console first to initialize –> Go to the Monitoring Pane –> Expand the “Sample Dashboard Demo 3” Folder:

When the selected object is in Healthy state:

When the selected object is in Critical state:
When the selected object is in Warning state:

Thank you for your support.
