Concurrency Visualizer SDK: Advanced Visualization Techniques
In the previous entry, I described basic usage scenarios of the Concurrency Visualizer SDK. In this entry, I will illustrate techniques to gain tighter control over the way you visualize meaningful events in your application.
The Application
To best illustrate the concepts in this entry, I’ll use a fictional weather simulation app. It simulates changes in weather using multiple iterations (each iteration represents an hour of simulation time). For each iteration, the app performs the following four-step calculation:
- Update solar input
- Calculate ground temperature
- Update atmospheric pressure
- Calculate precipitation
This simulation can be performed in parallel. In this application, I use C# and the .NET Thread Pool to parallelize the workload.
Without diving into the implementation of the simulation functions themselves, the code does this:
static void Main(string[] args)
{
DateTime simTime=new DateTime(2011, 11, 5, 0, 0, 0);
doneEvents = new ManualResetEvent[degreeOfParallelism];
for (int i = 0; i < doneEvents.Length; i++)
{
doneEvents[i] = new ManualResetEvent(false);
}
//each iteration represents one hour of weather activity
for (int n = 0; n < numIterations; n++)
{
//Phase 1 - Update solar input
for (int i = 0; i < degreeOfParallelism; i++)
{
doneEvents[i].Reset();
ThreadPool.QueueUserWorkItem(updateSolarInput, i);
}
WaitHandle.WaitAll(doneEvents);
//Phase 2 - Calculate ground temperature
for (int i = 0; i < degreeOfParallelism; i++)
{
doneEvents[i].Reset();
ThreadPool.QueueUserWorkItem(calculateGroundTemperature, i);
}
WaitHandle.WaitAll(doneEvents);
//Phase 3 - Update atmospheric pressure
for (int i = 0; i < degreeOfParallelism; i++)
{
doneEvents[i].Reset();
ThreadPool.QueueUserWorkItem(updateAtmosphericPressure, i);
}
WaitHandle.WaitAll(doneEvents);
//Phase 4 - Calculate precipitation
for (int i = 0; i < degreeOfParallelism; i++)
{
doneEvents[i].Reset();
ThreadPool.QueueUserWorkItem(calculatePrecipitation, i);
}
WaitHandle.WaitAll(doneEvents);
simTime=simTime.AddHours(1);
}
}
A static variable, degreeOfParallelism, defines the number of threads that simultaneously participate in the weather simulation. Since the results of each phase in an iteration depend on the previous phase, I use ManulResetEvents to effectively create a barrier, so threads don’t proceed to the next phase until all threads have finished the current phase.
In this example, I am running this on a machine with a dual core processor. I set degreeOfParallelism to 2 and ran the code for 2 iterations. I want to run this under the Concurrency Visualizer to get a general picture of the way this executes. I’m curious to know whether the phases are load balanced and roughly how long each phase takes. Here is a picture of the Threads View after running this under the Concurrency Visualizer:
From this view, I can see that the the Main thread simply queued the work items and blocked while the computation progressed. The three worker threads carried out the work (as shown by the green execution category). The worker threads aren’t 100% busy however. From this picture, it’s hard to know when each phase was carried out. As introduced in the previous entry, I can use a span to demarcate the execution of an application phase. But unlike the example shown in the previous entry, I want to use my own Marker provider, rather than use the default provider.
Creating Your Own Marker Provider
The expected convention is to use a single provider per application. I definitely want to use my own provider in order to avoid conflicts with other applications or libraries that already make use of the default Marker provider.
To create the provider in C#, I instantiate a new MarkerWriter object by specifying a GUID:
MarkerWriter writer = new MarkerWriter(
new Guid("9f34bddd-eae4-40c9-b668-91d78fc0b316"));
I can’t generate Marker events from the provider itself. Instead, I need to generate events from a MarkerSeries object. I’ll describe this further later in the entry. For now, think of a MarkerSeries as a serial channel of Marker events from a MarkerWriter. A MarkerWriter may have multiple MarkerSeries. I create my MarkerSeries using the following constructor:
MarkerSeries series = writer.CreateMarkerSeries("");
The constructor takes a string, meant as a friendly name of the series. At the moment, I’m only planning to use one series for this provider, so I’ll leave the name empty.
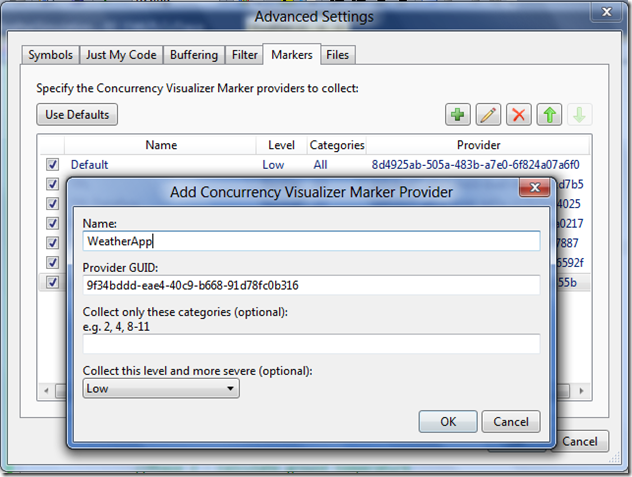
I am now ready to begin generating events from series. In order for the Concurrency Visualizer to listen to these events and display them in the Threads View, I need to register my new provider. To do so, I open the Advanced Settings Dialog (Analyze->Concurrency Visualizer->Advanced Settings). Next, I select the Markers tab. Here, I select the “Add new provider” button:
I type the friendly name of my provider (“WeatherApp”) and specify its GUID (the same one I used when instantiating the MarkerWriter).
Generating Spans and Flags
My first step is to surround each phase of my application with a Marker span. This way, I can see when each phase occurs on each thread. For example, on either side of calculating the ground temperature, I add the following calls:
var span = series.EnterSpan("Calculating Ground Temperature");
//code that calculates ground temperature

span.Leave();
In addition, I want to indicate the simulation time when I begin each iteration. I’ll add a flag whenever I begin a new iteration.
...
//each iteration represents one hour of weather activity

for (int n = 0; n < numIterations; n++)
{
series.WriteFlag("Iteration " + n +
": time = " + simTime.TimeOfDay);
//Phase 1 - Update solar input
...
Using my series object, I generate a flag specifying the iteration number and the corresponding simulation time. Simulation time is tracked in the simTime structure (DateTime).
As a result of adding these calls, I now see the following visualization in the Threads View:
I can see that the Main Thread generated two flags, which show the start of two iterations. Each worker thread generated spans when it entered and left each phase within an iteration. For example, I can see that Worker Thread 3400 executed all four phases within the first iteration but only two of the phases in the second iteration. Some of the text is cut off because there isn’t enough room to display it. I can hover over each span or zoom in to see its full description.
By adding these flags and spans, I can already understand a lot more about the way this application executes. As one example, I can see that the first phase in an iteration seems to take twice as long on one of the threads as compared to the other. This is clearly one area ripe for investigation.
Using Categories
In some cases, you may find it useful to differentiate various application events by groups. This is very specific to the set of events generated by each application. In this example, it makes sense for me to divide events into three categories:
- Events that describe the overall behavior of the weather simulation, such as an iteration beginning.
- Events related to calculations pertaining to the ground (i.e. solar absorption and ground temperature calculations).
- Events that relate to the atmosphere (i.e. calculating the atmospheric pressure and precipitation).
Therefore, I will group flags that mark the beginning of an iteration into category 0, spans that demarcate the updateSolarInput and calculateGroundTemperature phases into category 1, and spans that demarcate the updateAtmosphericPressure and calculatePrecipitation into category 2.
To specify the category for the flags I generate, I call a different overload of WriteFlag():
series.WriteFlag(0, "Iteration " + n +
": time = " + simTime.TimeOfDay);
In addition to the description, I now pass an integer that specifies that the flag belongs to category 0.
Similarly, to specify the category associated with the spans I generate, I make the following call:
var span = series.EnterSpan(1, "Calculating Ground Temperature");
//code that calculates ground temperature

span.Leave();
Since this span demarcates a region of code responsible for ground calculations, I group it with category 1. After making these changes, I run my code again under the Concurrency Visualizer and see the following picture:
Since I grouped my Markers into various categories, the Concurrency Visualizer displays them in different colors for the purpose of glancibility.
Using Importance Levels
Marker events aren’t all created equal. You may want to call a greater importance to certain events. I can use the Importance enum, which defines low, normal, high, and critical importance levels. For the purposes of illustration, suppose I consider the 0th iteration of this simulation to be incredibly unimportant while the 1st iteration is critically important. I can represent this in the flags I am generating for each iteration by adding Importance as a parameter when I write the flag. For the 0th iteration, I generate a flag with low importance:
series.WriteFlag(Importance.Low, 0, "Iteration " +
n + ": time = " + simTime.TimeOfDay);
And for the 1st iteration, I generate a flag with critical importance:
series.WriteFlag(Importance.Critical, 0, "Iteration " + n +
": time = " + simTime.TimeOfDay);
In this case, I’ll also consider the spans I generate for the calculateGroundTemperature phase to have high importance:
var span = series.EnterSpan(Importance.High, 1,
"Calculating Ground Temperature");
If an instantaneous event occurs that is severe enough, such as an exception being thrown, I may want to call special attention to it in my application. To do this, I can generate an alert. An alert is a special case of a flag, whose importance is critical. An alert’s category is the reserved –1 category. In my application, I added the following call to the code that throws an exception:
series.WriteAlert(e.Message);
e is the exception and the above alert simply wraps the exception’s message. After the above changes, I now see the following picture:
The difference in this picture is the changed appearance of the flags that mark the beginning of an iteration. The flag that marks the 0th iteration is now smaller while the other flag is larger and shows a ‘!’ (to indicate that it is critical). In addition, I can see a red flag that represents an alert generated by thread 3428 while it was calculating precipitation. When I hover over it, the tooltip shows the message of the exception I wrapped in the alert.
Using categories and importance levels is not only useful in affecting the appearance of Markers. These can also be used as parameters for filtering.
Filtering
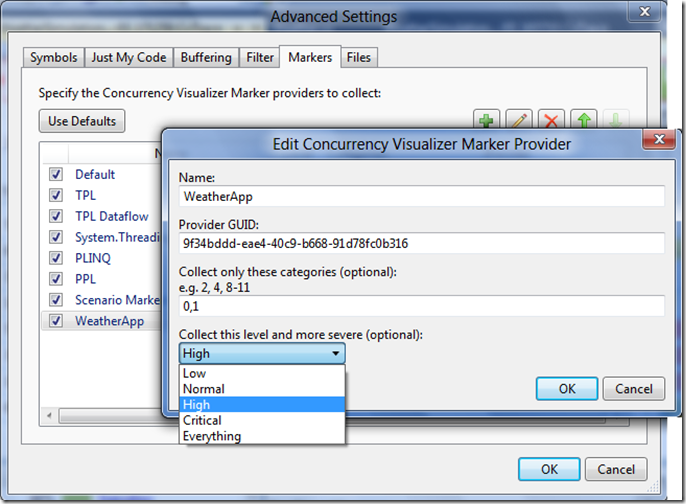
In some cases, you may not care to see unimportant Markers or Markers from a specific category. In fact, you may not want to see Markers from a particular provider at all. You can filter based on these characteristics in the Advanced Settings dialog. In this case, I only want to collect Markers from categories 0 and 1. Recall that this includes the flags that mark the beginning of iterations and spans that relate to ground calculations. In addition, I only want to collect events with importance of high or critical. I can configure this for my “WeatherApp” provider by selecting it and then clicking the “Edit provider” button:
I specify that I want to collect categories 0 and 1 by entering “0,1” in the categories field. If I wanted to collect a larger range of categories, such as 100 to 200, I could enter “100-200”. I specify that I only want to collect events with at least high importance by using the optional dropdown.
As an aside, I can choose not to collect events from a particular provider altogether by unchecking the box next to its name in the list of providers.
After changing these options, I now see the following picture:
Based on the options I selected, I now only see Markers with importance of high or critical and belonging to category 0 or 1. This includes the flag marking the beginning of iteration 1 and the spans marking the phase that calculates ground temperature.
Using Series
As I alluded to earlier in this entry, a Series is a logical grouping of events that are generated by a particular provider. If you need to break the events you are generating into different logical serial channels of events, you can use different Series under a single provider. This is especially meaningful and important when different series of events are independent of one another.
In my weather simulation, I showed the use of categories by breaking overall simulation events, ground events, and atmosphere events into distinct categories. To illustrate series, I’ll now remove the category distinctions, and instead generate these categories of events from different series. First, I need to create three different series:
overallSeries = writer.CreateMarkerSeries("Simulation");
groundSeries = writer.CreateMarkerSeries("Ground");

atmosphereSeries = writer.CreateMarkerSeries("Atmosphere");
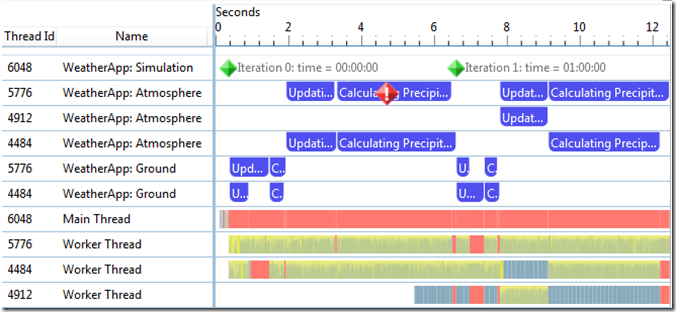
I give each series a descriptive name to help me remember the set of events generated by each. I’ll use the “Simulation” series to generate events that describe the simulation overall. This includes the events that mark the beginning of each iteration. I’ll use the “Ground” series for events related to ground calculations. This includes the spans that demarcate the updateSolarInput and calculateGroundTemperature phases. The “Atmosphere” series generates events pertaining to atmospheric calculations, namely, the updateAtmosphericPressure and calculatePrecipitation phases. After updating my code, I see the following picture when I run it under the Concurrency Visualizer:
I can now see that the description associated with each Marker channel shows the provider and the series. The top channel shows the events from the “Simulation” series, the next three show events from the “Atmosphere” series, and the next two show events from the “Ground” series. Markers from different series are shown in different channels in the Threads View. In particular, there is a unique Marker channel for each unique combination of thread ID, provider, and series.
Conclusion
As you can see from the previous entry, the basic features of the Concurrency Visualizer SDK are very simple to use. However, sometimes the basic usage scenarios just aren’t adequate when it comes to visualizing more complex patterns of application behavior. The Concurrency Visualizer SDK exposes more control over visualization for those who need it, but makes it easy to get started for those who don’t. Whether you need this type of control or not, I hope this entry at least gives you the tools to get started should you choose to. Whether used at a basic level or advanced level, the Concurrency Visualizer SDK can greatly decrease the time it takes to make sense of complex diagnostic data.
James Rapp – Parallel Computing Platform


