Beginner's Guide to Profiling Parallel Apps Part II
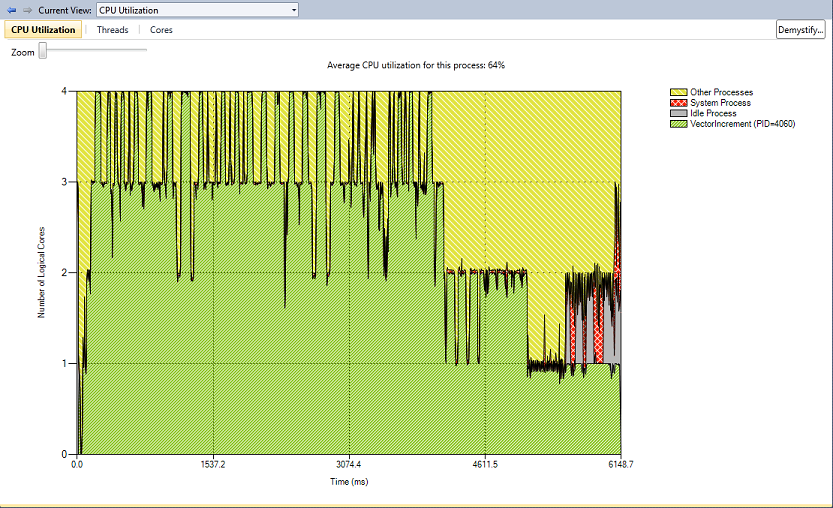
In my previous post, I described how to profile your multithreaded application using the Visual Studio Performance Wizard. As I mentioned, the summary report presented after profiling yielded three options. In this entry, I will discuss the "CPU Utilization" option. After clicking on this, the following screen appears:

This graph displays time along the x-axis and the number of logical cores along the y-axis. The legend explains what each color represents. The chart is colored mostly green, which represents my app's execution. The higher along the y-axis the green extends, the more CPU power was used at that point in time by my app. It is worth mentioning that the logical cores listed along the y-axis do not map to physical cores - this graph speaks nothing to thread affinity. For this, use the "cores" view.
This chart also indicates a noticable portion of CPU power used by other processes, colored yellow. This can provide a bit of insight into how other processes on the system are affecting your app's behavior. Based on this view alone, it's hard to draw any conclusions with perfect confidence. In the absence of other processes, I would expect my app to use 100% of the CPU the entire time before abruptly finishing. It appears that other processes prevent my app from using all of the CPU power, especially towards the beginning of its execution. I suspect that the "tapering" seen starting near four seconds results from some of the threads finishing earlier than others (which I wouldn't expect given the identical work-load). I can't be sure, however, until I look at the "Threads" view (described in my next post).
Overall, this profiling experience has been a success. By observing my app's CPU utlization, I have gained a lot of insight into its behavior. At the very least, it is using more than one core!
James Rapp - Parallel Computing Platform