Azure Log Analytics: Queries, the basics explained - Part 4
I’ll finish with some more examples, building on what we discussed in part 3.
SecurityEvent
| where Account has "Clive" // has is a best practise rather than contains
| project Account, Computer, EventID , EventSourceName // now I've selected a few columns of data I think are useful to reduce the noise
//or if you wanted to see a relationship between Clive and how many times that occurs you could do
SecurityEvent
| where Account has "Clive"
// now I'll selected a few columns of data I think are useful to reduce the noise
| summarize count () by Account, Computer, EventID , EventSourceName
// or Show where Clive occurs per computer over the last 7 days with intervals set to 60mins – then chart it
SecurityEvent
| where TimeGenerated > ago(7d) //set time scope to 7 days
| where Account contains "Clive"
| summarize count() by bin (TimeGenerated, 60min) , Computer // set time to 60min intervals and pivot on Computer field
| render timechart // create a timechart
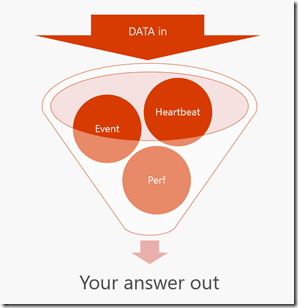
Essentially what each Log Analytics query does is reduce down a potentially massive set of data. I think of this as an inverted funnel - hopefully this diagram helps.
Its worth reading the Query Best Practise https://docs.loganalytics.io/docs/Language-Reference/Query-best-practices
A few of the DOs:
- Use time filters first. Azure Log Analytics is highly optimized to utilize time filters.
- Put filters that are expected to get rid most of the data in the beginning of the query (right after time filters)
- Check that most of your filters are appearing in the beginning of the query (before you start using 'extend')
- Prefer 'has' keyword over 'contains' when looking for full tokens. 'has' is more performant as it doesn't have to look-up for substrings.
