How much is that logging in the Window(s)
Sorry for the awful pun, but now you’re probably thinking I’m mad, either that or you now have the lyrics of “How much is that doggy in the window” racing around in your head.
Anyhow, the point of this post is to show something that I’ve carped on about for some time and that is logging – or more specifically “Do you know the resources your logging framework is using, especially when its turned off”.
I’ve advocated method entry/exit logging for ages – indeed I posted about this some while ago. The point of this post is to show why you need to look into your logging code and the difference a bit of profiling can do.
I was in the scalability labs this week with a customer who had liberally sprinkled method entry/exit logging all through the code. Top marks. That said, the implementation needed some tweaking as it was relatively expensive. Logging is like electricity – you should only pay for it if you use it. If you’ve gone around your house and turned off all unnecessary electrical devices then you know the deal – get an energy meter, check how much juice your DVD/Telly/whatever uses on standby, and then religiously turn them off. The same is true of logging – if it’s off it shouldn’t be using any resources, and you can use profiling to work out how costly or otherwise it is.
So, what was the code that I saw. It’s as follows…
 static void MethodUnderTest()
{
    CustomerLogger.WriteTrace(string.Format(
   CultureInfo.InvariantCulture,
          "Method Entered {0}", new object[] { "B1" }));

    // Do stuff here

    CustomerLogger.WriteTrace(string.Format(
  CultureInfo.InvariantCulture,
  "Left {0}", new object[] { "B1" }));
}
As there were a lot of methods that had the same code, and many methods called many others, you can imagine that the number of calls to the WriteTrace method was very high, so anything I could do here to speed things up would have some effect to the application and was well worth doing.
So, what’s the problem with the above? It’s all about being lazy.
If logging is off (which is normally the natural state for an application in production) you would ideally like your logging code to have limited effect – i.e. it shouldn’t cost anything if it’s disabled. The problem with the above is that, regardless of the state of logging, you’re paying for the call to string.Format (and in the customers case some other stuff within the WriteTrace method too) which could be avoided.
I popped together a small example application to replicate just what the customer was doing here, and running it under the Visual Studio profiler I could see that the the current method of logging was (for 100,000 iterations) taking 11.5s, and my proposed solution was down at 4.5s for the same test. That’s a fair amount of time being wasted, but it gets more interesting.
The next tool I used to look at the issue was the most excellent (and free!) CLR Profiler. This has been around since the dawn of time (OK, sometime in 2002 ish I seem to recall) and it’s a tool that you really should download and use. What this showed me was the amount of memory that the current logging method was using (remember, logging is switched off)…

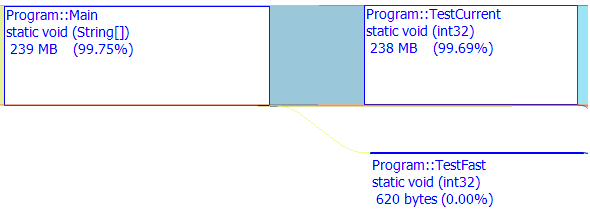
Here the graph shows that 99.69% of the memory used by the entire allocated was inside the TestCurrent method (which tests the current logging implementation). And only 620 bytes are allocated by my test method – which in effect does the same as logging is off. Yes, the same. If logging is turned off you really shouldn’t be allocating all of this junk, just to have it thrown away immediately when the logging class determines that no output is necessary.
You might ask – what’s allocating so much memory. Well, in the test I’m calling the candidate methods 100,000 times, and each test is calling down through 5 levels of method calls (which is a fair representation of what my customer was doing). So for one iteration that would be 10 calls to String.Format(), with the formatted string thrown away moments later. Each call was allocating a string, a string builder and a few other objects too.
The code I was using in the TestFast method was the MethodEntryExit logger I blogged about here. All I did to the customers code was remove their logging code and added in mine (which is trivial). Just to recap, I created a disposable class that is used as follows to write method entry/exit information (and timings too, if you so desire). Using it is a breeze…
 static void MethodUnderTest()
{
    using (MethodLogger.Log("MethodUnderTest",
        LogOptions.Entry | LogOptions.Exit, GlobalSource))
    {
        Fast2();
    }
}
The last parameter here is a TraceSource. If you’ve not come across this class before you should read up the essay (!) I wrote on logging in .NET over on CodePlex.
The moral of the story is – check how much you’re paying for logging if it’s off. There really should be little or no overhead!
Originally posted by Morgan Skinner on 04 December 2009 here.