Performance Anxiety
Recently, I was in need of doing some performance troubleshooting, and used Windows’s built in performance monitor, naturally. While doing this, I noticed that although I configured the monitor to log the counters for some processes (like IIS’s processes), when I was opening the log file for review on my server, I wasn’t seeing any of that shown. I did see a bunch of graphs for other relevant objects, but not the Process object. I tried logging and relogging the server several times, but to no avail.
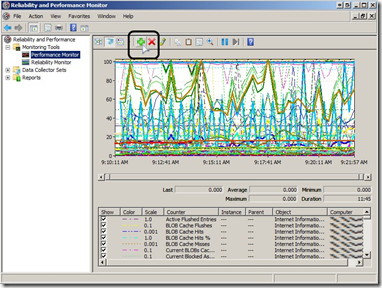
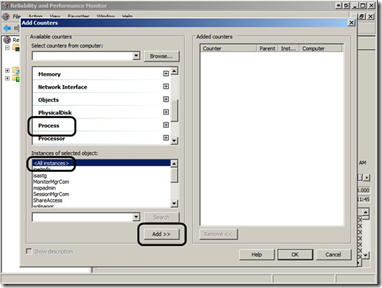
After drilling into this for a while, I was kindly told that the monitor hides this data by default, as the displaying the process information is CPU-intensive. This could be easily solved by clicking on the + sign at the top, and adding the process info:
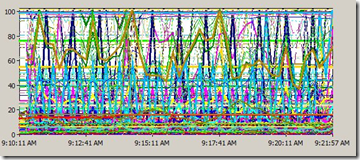
Of course…the resulting graph might be a bit crowded:
I’m also glad to report that this behavior has been changed for Windows 7 and Windows 2008 R2. With these OS versions, the default behavior is to display all the counters. If you were conflicted about upgrading to Windows 7…here’s your solid reason to go ahead!
Comments
- Anonymous
February 21, 2014
We’ve gathered the top Microsoft Support solutions to the most common issues experienced using - Anonymous
May 16, 2014
We’ve gathered the top Microsoft Support solutions for the most common issues experienced when - Anonymous
May 16, 2014
We’ve gathered the top Microsoft Support solutions for the most common issues experienced when - Anonymous
July 21, 2014
We’ve gathered the top Microsoft Support solutions for the most common issues experienced when - Anonymous
July 21, 2014
We’ve gathered the top Microsoft Support solutions for the most common issues experienced when


