Managing Documentation Projects in Team Foundation Server, Part 3: Reporting Status
Here is the third and last post on a series of posts on managing documentation efforts using TFS. Full credit given to my friend Allen Clark, in our User Education group who provided all the content for these posts. Thank you very much Allen! You guys do a great job.
------
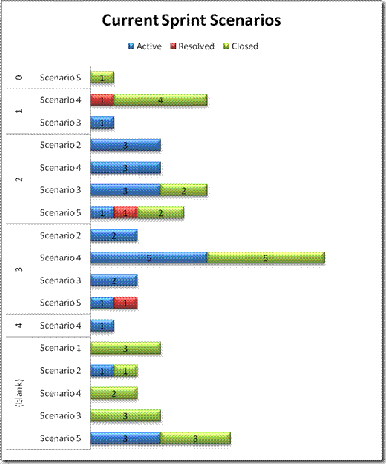
In my first two posts, I described how we plan our sprints and use a list of work items to manage our workload. Based on the list of work items, I also create a PivotChart report, which we use to check our progress and make corrections. Here’s our report for September 2007:
Creating a PivotChart report from a list of work items is pretty simple. Here’s an outline:
1. Select one or more cells in the list of work items, and insert a PivotChart report.
To insert a PivotChart report, open the Insert menu, point to PivotTables, and click PivotChart.
2. Specify a field, such as ID, as the count. By default, the “count” is summarized by adding the values from each work item. If you use a field that contains hours of work, such as Remaining Work, that will be what you want. However, if you are just counting work items using a field such as ID, you’ll have to change the field settings to summarize the value by counting.
3. Specify the Axis field. My report uses the field that contains the scenario names.
4. Add State as a legend field to slice your report into separate series for each of the work item states.
After you create your first report, you can experiment with different layouts and types of charts. I like the stacked-bar and stacked-column charts (depending on how the axis labels look) and Layout 2. For bar charts, you should make sure that your chart is tall enough to print every line. Otherwise, you end up with unlabeled bars. I also add filters using fields such as Priority and Assigned To. That tactic makes ad-hoc analysis much easier.
-- Allen Clark (blog)
Comments
Anonymous
October 31, 2007
The Teams WIT Tools Blog on Managing Documentation Projects in Team Foundation Server, Part 3: Reporting...Anonymous
November 07, 2007
The third post in my series on using TFS to manage documentation projects is available here. http://blogs.msdn.com/teams_wit_tools/archive/2007/10/29/managing-documentation-projects-in-team-foundation-server-part-3-reporting-status.aspxAnonymous
November 07, 2007
The third post in my series on using TFS to manage documentation projects is available here. http://blogsAnonymous
March 08, 2009
Back in 2007, I wrote three articles on how the Team Foundation user education team was using work item
