Windows Azure Walkthrough: Simple Logging
With Windows Azure Diagnostics, applications can perform logging using the familiar .Net Trace() APIs.
In this post we will create a new Cloud Service project using and look at the wiring that is done automatically to make Windows Azure Diagnostics, and specifically simple logging, work.
Simple Logging in a new Cloud Service project
1. Open Visual Studio as Administrator
2. Click on File | New | Project…
3. Select Visual C# | Cloud Service | Windows Azure Cloud Service
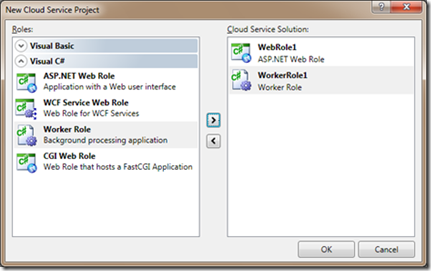
4. In the ‘New Cloud Service Project’ wizard select ‘ASP.Net Web Role’ and ‘Worker Role’ and click OK.
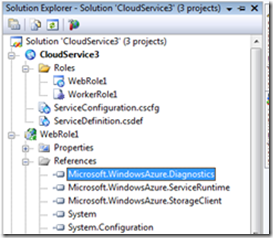
5. In Solution Explorer, expand the References in WebRole1. A reference to Microsoft.WindowsAzure.Diagnostics.dll has been added. This is the dll that exposes the diagnostics configuration and management APIs.
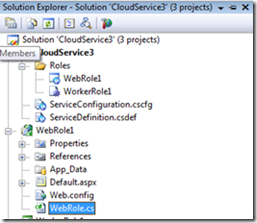
6. Open WebRole.cs in WebRole1 project.
7. A new using statement that has been added to this file
This brings in the Windows Azure Diagnostics name space into the role.
8. Going further down in WebRole.cs, the following line of code is found in WebRole.OnStart() method.
This line of code starts up the Diagnostic Monitor, mentioned in my earlier post. This is the component that runs along with the role and is responsible for the collection of diagnostic data on the node.
This line of code passes in the configuration setting name that is equal to the connection string for the storage account that Diagnostic Monitor needs to use to transfer the diagnostic data to.
NOTE: The configuration setting name can be any name that define in the *.cscfg file.
9. Open up ServiceDefinition.cscfg to see what the connection string looks like.
The default VS template sets up the connection string name as ‘DiagnosticsConnectionString’ and the value as ‘UseDevelopmentStorage=true’. This particular connection string sets up Diagnostics Monitor to use Development Storage account.
The connection string can be changed to point to a cloud storage account as well as shown below
<ConfigurationSettings>
<Setting name="DiagnosticsConnectionString"
value="DefaultEndpointsProtocol=https;AccountName=<ACCOUNT_NAME>;AccountKey=<ACCOUNT_KEY>"/>
</ConfigurationSettings>
10. Step 5-9 are applicable for the worker role in the project as well.
11. Open Web.config in the Web Role project. The following following section has been added to web.config
This adds the Diagnostic Monitor Trace Listener to the role such that Trace() calls made in the application are collected by Diagnostic Monitor as well.
NOTE: The same section is added to the worker role’s app.config.
12. With Steps 5-11 all the wiring needed to generate and collect simple logs with Trace() APIs is done. In the current project, some sample TraceLine() calls that have already been added.
13. To illustrate the transfer of logs add the following lines in WebRole.cs file. We will delve deeper into the transfer mechanism in a subsequent post.
For now it is sufficient to know that this code sets up the configuration of simple logs such that they are automatically transferred every minute to the storage account that was configured in Step 9.
a. Add the following ‘using’ statements
b. Add the following lines to OnStart() method
public override bool OnStart()
{
//DiagnosticMonitor.Start("DiagnosticsConnectionString");
DiagnosticMonitorConfiguration dmc = DiagnosticMonitor.GetDefaultInitialConfiguration();
dmc.Logs.ScheduledTransferPeriod = TimeSpan.FromMinutes(1);
dmc.Logs.ScheduledTransferLogLevelFilter = LogLevel.Verbose;
DiagnosticMonitor.Start("DiagnosticsConnectionString", dmc);
}
c. Add the following method to the WebRole class
public override void Run()
{
int count = 0;
for (; ; )
{
count++;
Trace.WriteLine("Message: " + count, "Information");
Thread.Sleep(TimeSpan.FromSeconds(10));
}
}
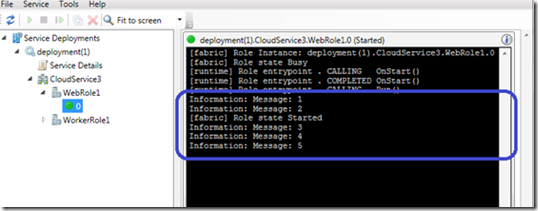
14. Hit F5 to start debugging the project. The logs from the WebRole are shown in Development Fabric.
15. To see the collection of these logs in the storage account (Development Storage in this example), lets open up the account in a storage viewer tool. For this example we will use the Cloud Storage Studio tool from Cerebrata.
What’s next
We have looked at all wiring that has already been done to integrate Windows Azure Diagnostics in a cloud service project. We have also looked at how simple Windows Azure logs work. Next time we will explore more types of diagnostics data can be collected for the service, e.g. Performance Counters, Failed Request Logs, etc.
Comments
Anonymous
February 01, 2010
Good one and easy to understand. Please blog for perf counters, event viewers etc. also. Thanks!!Anonymous
July 15, 2010
Great information, I just bookmarked you.Anonymous
January 03, 2011
It is just writing the endpoint calling and errors of work role. when we add a webrole to this project , then it is not showing the error of that.How to trace the errors of whole application ...? please reply me...Anonymous
January 03, 2011
and also i have to write "Trace.writeline(exception)" so that is is writing in log .. but the main problem is this when i host the service on azure server then it stop working.it just work when i uses it on my local machine connecting with azure accountAnonymous
March 02, 2011
Thanks for this... I would recommend taking larger screen shots next time, they are hard to read.Anonymous
March 07, 2012
the setting 'DiagnosticsConnectionString' for Role WebRole1 is specified in the service configuration file, "but it is not declared in the service definition file"


