Tools of the Trade: Part IV - Developing WinDbg Extension DLLs
A WinDbg extension DLL is set of exported callback functions for implementing user defined commands to extract specific customized information from the memory dump(s). Extension DLLs are loaded by debugger engine and can provide extra functionality of automation tasks while performing user-mode or kenrel-mode debugging. An extension DLL may export any number of functions that are used to execute extension commands. Each function is explicitly declared as an export in the DLL's definition file or .def file and function names must be in lowercase letters
WinDbg (DbgEng ) extension DLL must export DebugExtensionInitialize. This will be called when the DLL is loaded, to initialize the DLL. It may be used by the DLL to initialize global variables.
An extension DLL may export an optional function DebugExtensionUninitialize. If this is exported, it will be called just before the extension DLL is unloaded.
An extension DLL may export a DebugExtensionNotify. If this is exported, it will be called when a session begins or ends, and when a target starts or stops executing. These notifications are also provided to IDebugEventCallbacks objects registered with a client.
An extension DLL may export KnownStructOutput. If this is exported, it will be called when the DLL is loaded. This function returns a list of structures that the DLL knows how to print on a single line. It may be called later to format instances of these structures for printing.
So, how to develop your own Windbg Extension DLL? Lets follow these steps:
1. Download & Install debugging tools for windows from https://www.microsoft.com/whdc/devtools/debugging/installx86.Mspx
2. Create "Win32 Console Application" using VS 2008
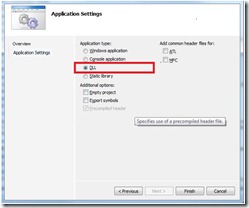
3. Select Application type as "DLL" and click "Finish" .
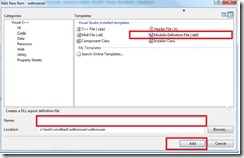
4. Add a "Module-Definition File (.def)" called "wdbrowser" to the project. One way to export your extension function is by specifying the function names in the EXPORTS section of the .def file. You may you use other ways of exporting functions, such as __dllexport
5. Configure the project "Additional include Directories" to point to header files that comes with Windbg. Default folder for x86 is "C:\Program Files\Debugging Tools for Windows (x86)\sdk\inc"
6. Configure the project "Additional Library Directories" to point to library files that comes with Windbg. Default folder for x86 libraries is ""C:\Program Files\Debugging Tools for Windows (x86)\sdk\lib\i386""
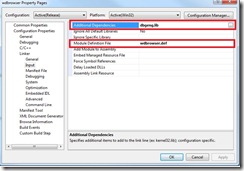
7. The library, "dbgeng.lib " & "dbgeng.dll" has the implementation of the Debug engine exported functions. So, add "dbgeng.lib" in "Additional Dependencies".
8. Add name of the module definition file created at the above Step #3
9. Now Include the following required headers files in "stdafx.h"
#include <windows.h>
#include <imagehlp.h>
#include <wdbgexts.h>
#include <dbgeng.h>
#include <extsfns.h>
10. Declare following two global variables in your extension project main implementation file.
//Version.
EXT_API_VERSION g_ExtApiVersion = {1,1,EXT_API_VERSION_NUMBER,0} ;
WINDBG_EXTENSION_APIS ExtensionApis = {0};
11. Declare following debug engine COM interface pointers.
IDebugAdvanced2* gAdvancedDebug2=NULL;
IDebugControl4* gDebugControl4=NULL;
IDebugControl* gExecuteCmd=NULL;
IDebugClient* gDebugClient=NULL;
12. Next step is to declare and implement WinDbgExtensionDllInit function in your DLL main implementation source file. In this example that is "wdbrowser.cpp" . The WinDbgExntensionDllInit is the first function that will be called by windbg . So, this function is the idle for implementing any extension specific initialization or related functionality. Please refer https://msdn.microsoft.com/en-us/library/cc267872.aspx for more details about this function.
VOID WDBGAPI WinDbgExtensionDllInit (PWINDBG_EXTENSION_APIS lpExtensionApis, USHORT usMajorVersion, USHORT usMinorVersion)
{
ExtensionApis = *lpExtensionApis;
HRESULT hResult = S_FALSE;
if (hResult = DebugCreate(__uuidof(IDebugClient), (void**) &gDebugClient) != S_OK)
{
dprintf("Acuqiring IDebugClient* Failled\n\n");
return;
}
if (hResult = gDebugClient->QueryInterface(__uuidof(IDebugControl), (void**) &gExecuteCmd) != S_OK)
{
dprintf("Acuqiring IDebugControl* Failled\n\n");
return;
}
if (hResult = gDebugClient->QueryInterface(__uuidof(IDebugAdvanced2), (void**) &gAdvancedDebug2) != S_OK)
{
dprintf("Acuqiring IDebugAdvanced2* Failled\n\n");
return;
}
if (hResult = gDebugClient->QueryInterface(__uuidof(IDebugControl4), (void**) &gDebugControl4) != S_OK)
{
dprintf("Acuqiring IDebugControl4* Failled\n\n");
return;
}
}
13. Declare another exported function ExtensionApiVersion to report the version of your extension to windbg. Please refer to https://msdn.microsoft.com/en-us/library/cc267873.aspx for detailed information about this function.
LPEXT_API_VERSION WDBGAPI ExtensionApiVersion (void)
{
return &g_ExtApiVersion;
}
14. Define Debug engine's interface pointers, so that your extension module can interact with debug engine. For more information please refer
https://msdn.microsoft.com/en-us/library/cc265976.aspx - IDebugClient, https://msdn.microsoft.com/en-us/library/cc266102.aspx - IDebugControl
https://msdn.microsoft.com/en-us/library/cc265957.aspx - IDebugAdvanced
IDebugAdvanced2* gAdvancedDebug2=NULL;
IDebugControl4* gDebugControl4=NULL;
IDebugControl* gExecuteCmd=NULL;
IDebugClient* gDebugClient=NULL;
15. Next step is to - implement debug engine's callback interface IDebugOutputCallbacks . Debug engine callbacks your implementation of IDebugOutCallbacks::Output() with output as a result of the commands that are executed by your extension function.
Refer to https://msdn.microsoft.com/en-us/library/cc265716.aspx for detailed information about IDebugOutputCallbacks::Output()
16. Add the following new class in a header file that inherits the IDebugOutputCallbacks interface .
#ifndef __OUT_HPP__
#define __OUT_HPP__
#include <string>
#include <sstream>
class StdioOutputCallbacks : public IDebugOutputCallbacks
{
private:
std::string m_OutputBuffer;
//
//This buffer holds the output from the command execution.
//
CHAR m_OutPutBuffer[4096];
public:
void InitOutPutBuffer();
std::string GetOutputBuffer()
{
return m_OutputBuffer;
};
void ClearOutPutBuffer()
{
m_OutputBuffer = "";
};
STDMETHOD(QueryInterface)(
THIS_
IN REFIID InterfaceId,
OUT PVOID* Interface
);
STDMETHOD_(ULONG, AddRef)(
THIS
);
STDMETHOD_(ULONG, Release)(
THIS
);
// IDebugOutputCallbacks.
STDMETHOD(Output)(
THIS_
IN ULONG Mask,
IN PCSTR Text
);
};
extern StdioOutputCallbacks g_OutputCb;
#endif // #ifndef __OUT_HPP__
17. Add the following code that implements the IDebugOutputCallbacks interface methods, especially Output()
#include "stdafx.h"
#include <stdio.h>
#include <windows.h>
#include <dbgeng.h>
#include "OutputCallBack.h"
StdioOutputCallbacks g_OutputCb;
STDMETHODIMP
StdioOutputCallbacks::QueryInterface(
THIS_
IN REFIID InterfaceId,
OUT PVOID* Interface
)
{
*Interface = NULL;
if (IsEqualIID(InterfaceId, __uuidof(IUnknown)) ||
IsEqualIID(InterfaceId, __uuidof(IDebugOutputCallbacks)))
{
*Interface = (IDebugOutputCallbacks *)this;
AddRef();
return S_OK;
}
else
{
return E_NOINTERFACE;
}
}
STDMETHODIMP_(ULONG)
StdioOutputCallbacks::AddRef(
THIS
)
{
// This class is designed to be static so
// there's no true refcount.
return 1;
}
STDMETHODIMP_(ULONG)
StdioOutputCallbacks::Release(
THIS
)
{
// This class is designed to be static so
// there's no true refcount.
return 0;
}
STDMETHODIMP
StdioOutputCallbacks::Output(
THIS_
IN ULONG Mask,
IN PCSTR Text
)
{
UNREFERENCED_PARAMETER(Mask);
m_OutputBuffer += Text;
return S_OK;
}
void StdioOutputCallbacks::InitOutPutBuffer()
{
m_OutputBuffer.erase();
}
18. Add implementation of your extension function. In this example, we choose to implement an extension that displays the variable names, types in the frame 2 of the current thread. The implementation is:
DECLARE_API (dvf3)
{
//
// Install output callbacks.
//
if ((gDebugClient->SetOutputCallbacks((PDEBUG_OUTPUT_CALLBACKS) &g_OutputCb))!= S_OK)
{
dprintf("*****Error while installing Outputcallback.*****\n\n");
return;
}
//
// Since frame count starts from 0 index, we have to pass 2 as parameter for .frame command for the frame# 2
//
//Execute command to extrac 2nd frame.
if (gExecuteCmd->Execute(DEBUG_OUTCTL_THIS_CLIENT | //Send output to only outputcallbacks
DEBUG_OUTCTL_OVERRIDE_MASK |
DEBUG_OUTCTL_NOT_LOGGED,
".frame 2",
DEBUG_EXECUTE_DEFAULT ) != S_OK)
{
dprintf("Executing .frame 2 failled\n");
return;
}
//Execute command to extrac 2nd frame.
if (gExecuteCmd->Execute(DEBUG_OUTCTL_THIS_CLIENT | //Send output to only outputcallbacks
DEBUG_OUTCTL_OVERRIDE_MASK |
DEBUG_OUTCTL_NOT_LOGGED,
"dv /i /t /v",
DEBUG_EXECUTE_DEFAULT ) != S_OK)
{
dprintf("Executing dv /i /t /v failled\n");
return;
}
dprintf("***** Extracting locals & formal params from frame 2 *****");
dprintf("\n%s\n", g_OutputCb.GetOutputBuffer().c_str());
}
19. Re-build the project. Copy the .DLL from release folder to a folder where Windbg looks for extension DLLs.
On x86 machine default location is "<Drive letter>\Program Files\Debugging Tools for Windows (x86)\winext"
20. The extension is ready for the use or test.
21. Start windbg and open a full user mode dump. Type .load myextension and hit enter to load the extension DLL into Windbg process space
22. Run .chain command to verify if your extension is loaded by WinDbg . you will see output similar to below output, if your extension is loaded.
23. Type !dvf3 to run the extension function for extracting and displaying variable names, types from the frame 2 .
Additional references:
https://msdn.microsoft.com/en-us/library/cc265826.aspx - describes about how to Interact with debug engine, I/O operations with debug engine, Memory access, Using symbols, source files.
https://www.codeplex.com/ODbgExt - Microsoft Open Debugger Extension for Windbg
Happy developing debug engine extensions!
Posted By: Srini Gajjela & Enamul Khaleque (DSD-SQLDeveloper group @ Microsoft)
Comments
- Anonymous
June 08, 2010
Thanks for the post. I needed to use a callback in my extension - you've written most of it for me.


