Operator progress changes in LQS
EDIT (11/12/2016): With the October release of SQL Server Management Studio, operator percentage calculations include multiplying the estimated rows by estimated executions and then compare with actual rows (which already accounted for all executions).
One of the useful features that shipped with SQL Server 2016 is LQS (Live Query Statistics), which is also compatible with SQL Server 2014. This feature provides real-time insights into the query execution process, as data flows from one query operator to another. This is very useful namely in long running query scenarios, to pinpoint hot spots in the plan that would otherwise be very difficult to determine.
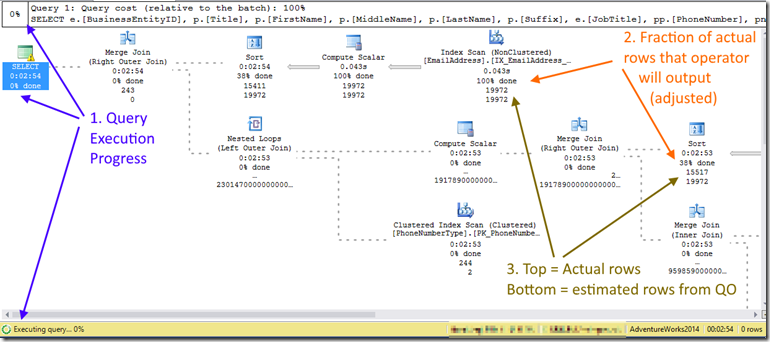
Until the July release of SQL Server Management Studio, you could see something like below using LQS:
- Shows the overall percentage of query execution progress, and this progress is continuously adjusted as it executes.
- The percentage show here is a fraction of the actual rows the operator will output when completed, and this is again adjusted as the query executes. It is not the ratio between actual rows and the numbers of rows estimated by the QO, as it is generally perceived.
- The top number is the actual number of rows, the bottom being the numbers of rows as estimated by the QO.
You can see in the picture above a clear example of how the percentage is not the ratio between actual rows and numbers of rows estimated by the QO. In the SORT operators you can see 38%, where if it were a ratio between actual rows and numbers of rows estimated by the QO, you would see roughly 77%.
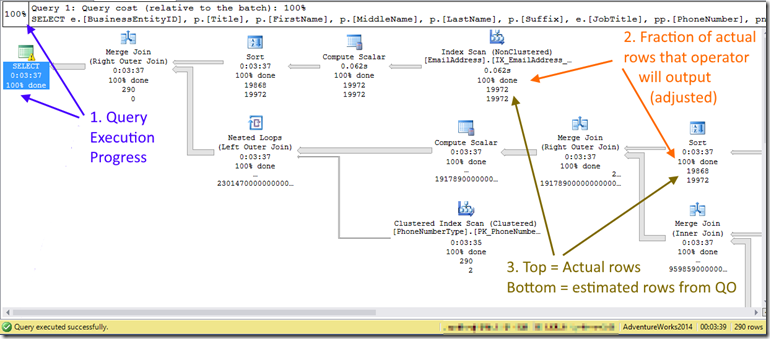
Below you can see the finished query. Given what was explained above, it becomes easier to understand that progress estimation cannot exceed 100% even at the operator level.
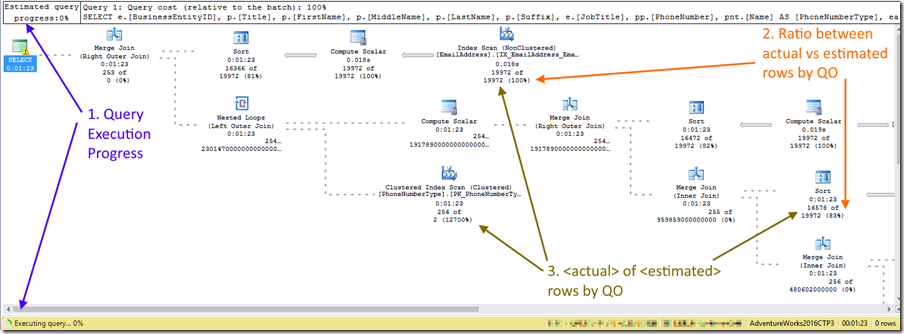
With the latest SQL Server Management Studio -16.3 (August 2016) release, we have addressed a perception aspect of using Live Query Statistics, expecting this to make it easier for any user of LQS:
- The percentage of estimated, overall query progress hasn’t changed, as it’s based in our progress estimation algorithm as before,. But to avoid misconceptions it has been removed from the root node (SELECT).
- The percentage shown at the operator level is now the ratio between actual rows and the numbers of rows estimated by the QO. These can run over or under as seen in the picture below, which will provide a more straightforward insight into estimation skews.
- Provides a clearer meaning to the numbers shown here: actual rows of estimated rows by the QO.
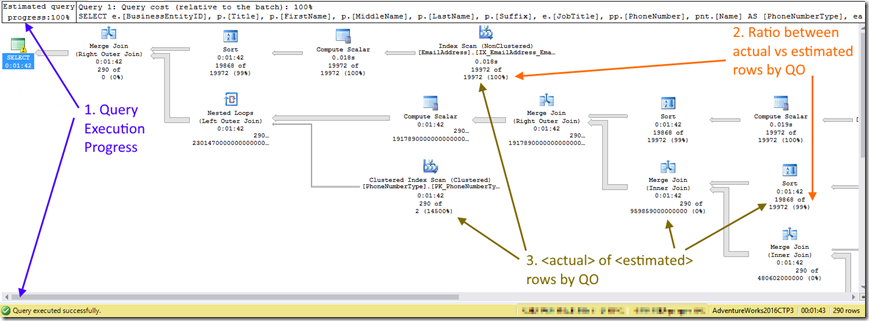
Below the finished query. Again, overall query execution cannot go over 100%, but at the operator level, percentages are shown as the real ratio between actual and estimated rows, with no caps.
So you can see how the actual rows from the clustered index scan on PhoneNumberType table was 14500% above estimations, and how a series of severe misestimations are coming from the bottom right area of the plan (where actual is not even 1% of estimated rows), worsening as it goes up in the nodes.
Pedro Lopes (@sqlpto) – Senior Program Manager
Comments
- Anonymous
August 23, 2016
Thanks for the informative post. I'm glad to see the team is continuing to invest in SSMS, and I agree that in most cases it is nice to quickly view plan operators that are >> 100% in real time as a query is executing rather than have the number capped at 100%. I was previously doing so with our own procedure that wraps sys.dm_exec_query_profiles, but it's nice to have the info in LQS directly as well. - Anonymous
August 23, 2016
The comment has been removed


