Columnstore Index Performance: BatchMode Execution
In the blog Industry leading analtyics query performance, we had looked into how SQL Server delivers superior analytics query performance with columnstore index. Besides significant reduction in IO, the analytics queries get order of magnitude better performance boost with BatchMode processing, a unique value proposition in SQL Server. The basic idea of batch mode processing is to process multiple values, hence the term ‘batch’, together instead of one value at a time. Batch mode processing is perfectly suited for analytics where a large number of rows need to be processed, for example, to compute aggregates or apply filter predicates. While the performance gains will depend upon the operator, data and the schema, we have measured the speedup up to 300x in some of our internal tests.
Though there are cases where BatchMode processing can boost query performance in transactional (OLTP) workload but at this time, the BatchMode processing is only supported in queries that reference one or more objects with columnstore index. Itzik an-Gan has listed some clever tricks that you can do to force BatchMode execution on rowstore to get pretty amazing query performance.
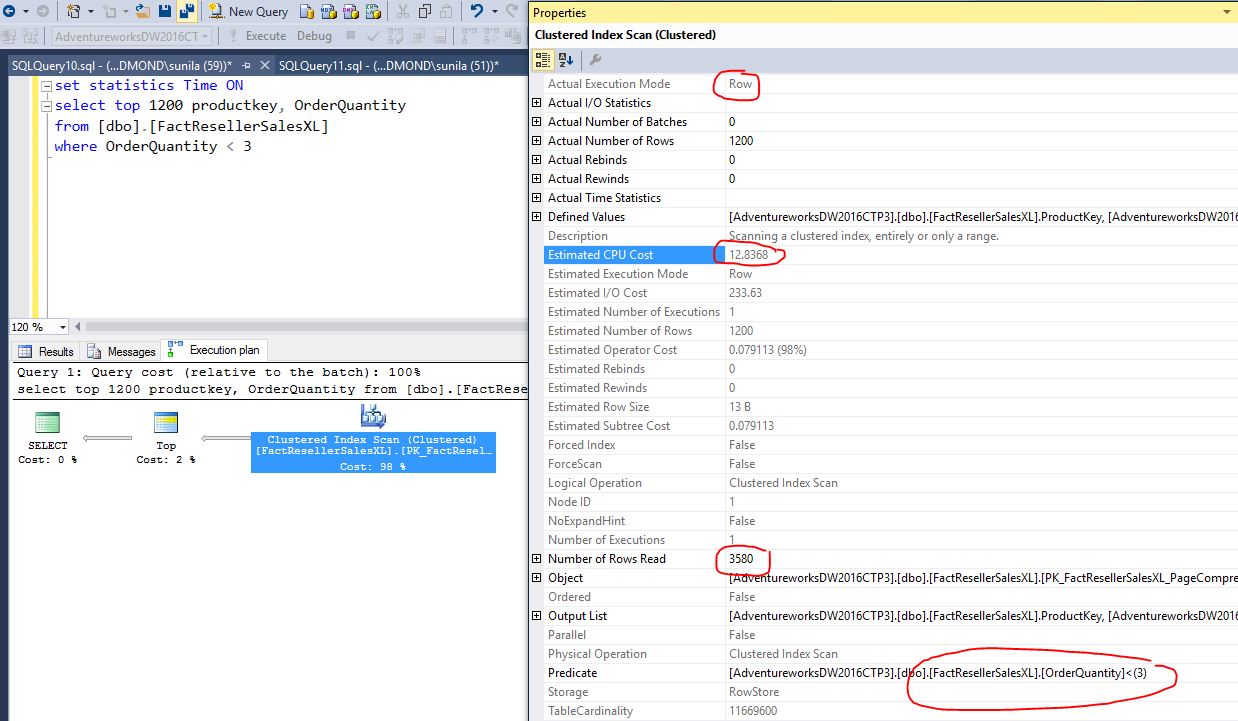
Before diving deeper into BatchMode processing, let us first look into how query processing is done in RowMode using a very simple query that outputs top 1200 rows satisfying a simple predicate on the table FactResellerSalesXL table in AdventureWorks2016CTP3 database. Key points (circled in red) from the following picture are
- Query was executed in ROW mode. The predicate was applied to 3580 rows, one row at a time, to get 1200 qualified rows
- The estimated CPU cost is 12.368 units. The actual CPU cost was 15 ms (I got this from Messages pane in SSMS) SQL Server Execution Times: CPU time = 15 ms, elapsed time = 312 ms

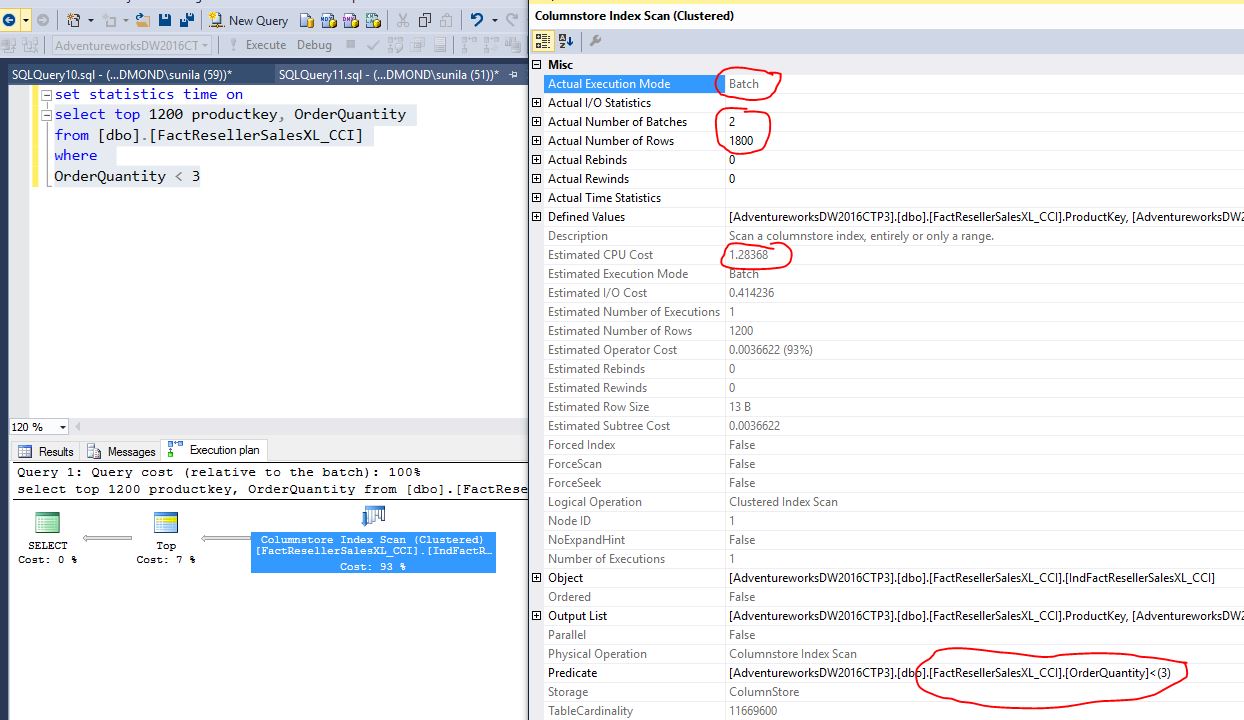
Now, let us execute the same query on a table with clustered columnstore index as shown in the following picture. The key points (circled in red) are:
- The query (specifically SCAN operator) was executed in BatchMode. There were two batches, each containing 900 rows, were executed. The predicate was applied to 900 rows at one time. The two batches were executed
- The estimated CPU time is 1.2338 which is estimated to be 10x faster. To make this number real, here is the actual execution time is < 1 ms (the minimal time that can be measured), so the rowstore execution took 15x more CPU compared to BatchMode execution.
SQL Server Execution Times: CPU time = 0 ms, elapsed time = 196 ms

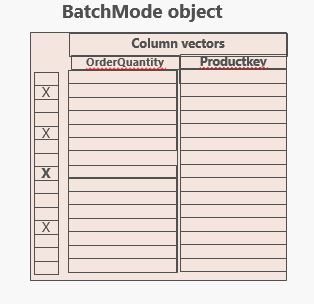
You may be wondering what is this magic number 900 rows within a batch? Well, when executing a query in BatchMode, SQL Server allocates a 64k bytes structure to group the rows. The number of rows in this structure can vary between 64 to 900 depending upon number of columns selected. For the example above, there are two columns that are referenced and X marks the rows that qualified in the BatchMode structure shown in the picture below. If SCAN is part of a bigger query execution tree, the pointer to this structure is passed to the next operator for further processing. Not all operators can be executed in BatchMode. Please refer to Industry leading analtyics query performance for details on BatchMode Operators.

SQL Server automatically chooses to execute supported operators in BatchMode. A query execution plan can have a mix of BatchMode/RowMode operators with automatic conversion between the modes. I highly recommend you to look the actual execution plans to validate that the supported operators are indeed getting executed in BatchMode and if not, please take a corrective action. For example, the Nested Loops or Merge Join operators are not executed in BatchMode. If in a rare case, the query optimizer has chosen these, you can get around this by hinting Hash Match execution.
Thanks,
Sunil Agarwal
SQL Server Tiger Team
Follow us on Twitter: @mssqltiger | Team Blog: aka.ms/sqlserverteam