VSTS 2010 Feature: ASP.NET profiler integration with Load Tests
One of the new features in VSTS 2010 is Data Collectors. Data collectors can run as part of your test run and then associate the data collected with the test. This is also an extensibility point. You can create your own data collectors and store any kind of data with your test runs. The following are available out of the box:
- ASP.NET Client Proxy for IntelliTrace and Test Impact
- ASP.NET Profiler
- Code Coverage
- Event Log
- IntelliTrace
- Network Emulation
- System Information
- Test Impact
- Video Recorder
This link can give you more high level information about data collectors: Data Collectors
I am going to focus on the ASP.NET Profiler collector and show you how this can integrate with load tests. First off this collector profiles the IIS process, so it will not work against the development web server. For this demo I setup the IbuySpy website. To profile the web site, you need to install an agent on the machine that the IIS is running on. This agent will not be generating load, but will be a collection only agent. The link above goes into detail about how to create and configure these types of agents. So let’s walk through process of running a load test with the ASP.NET profiler collector running.
- Create a new test project
- Create a Web Performance Test that will test the web site you want to profile. I recorded a test that adds an item to the shopping cart, logs into the site and then places the order.
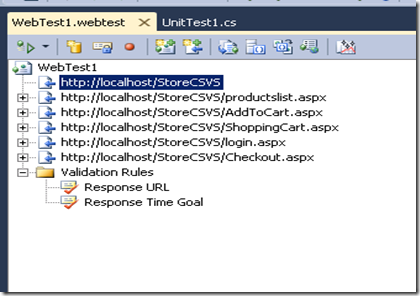
- Now Create a Load Test and add the web test.
- Before we run the test, we need to modify the run settings and tell it to run the ASP.NET data collector. So go to the top level test menu, select Edit Test Settings and then select the active test setting.
- I am running my test locally and have IIS running locally, so I do not need to configure roles. But if you are running IIS on a different machine, follow the link above to create appropriate role. Then Click on the “Data and Diagnostics” tab.
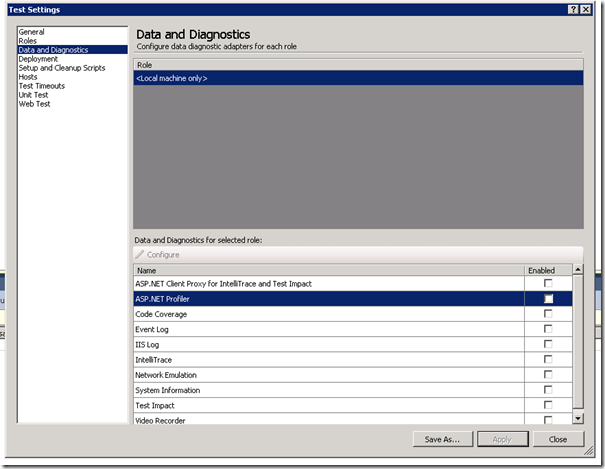
- Choose the correct role for your IIS machine and then click the enabled check box for the ASP.NET profiler.
- Now the test is ready to run. Just start your load test like you normally do. Click the play button on the Load Test Editor toolbar. while the test is running, you will not see any differences. When the test completes, go to the post run view.
- In the post run view, you will see a new button on the load test execution UI toolbar.
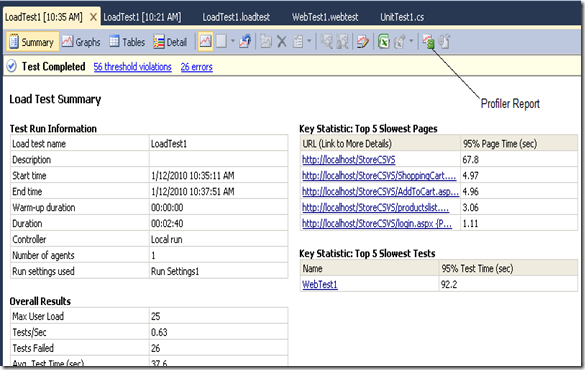
- Click the Profiler Report button which is the second from the right. This will generate a profiler report. Here is the initial page:
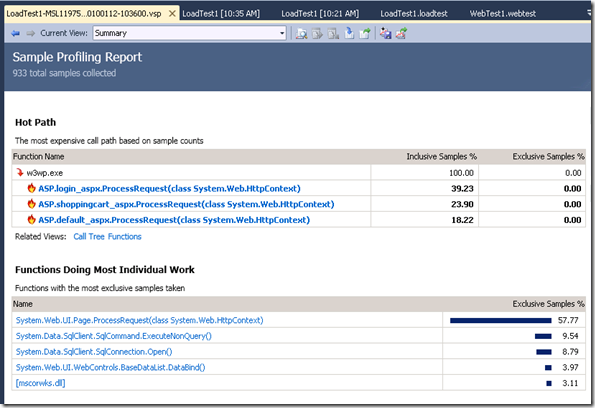
- Check out this help link to get more information on all the data that is available in the profiler report: Profiler Report Information
- I do want to point out one new feature of the profiler that I particularly like and that is the database interaction page. Change the current view from Summary to “Tier Interactions”. Then expand the node for one of your pages. I am expanding the login page. When I expand it I see the following:
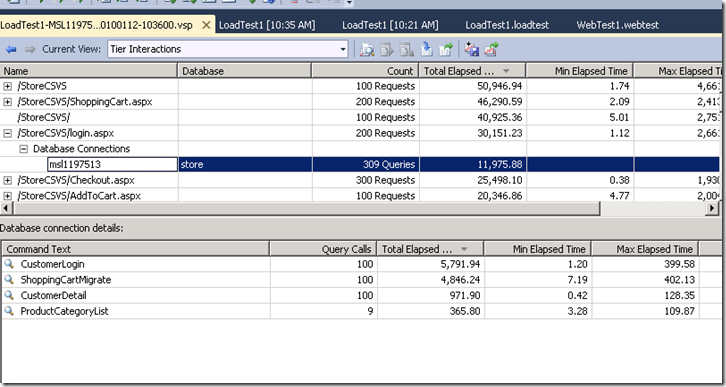
- This is showing me my database connections and when I click on a connection, it is showing me the calls that were made. In the command text column, you see the stored procedures that were called on the login page. Then you see # of times each was called and elapsed time. This is an awesome view into the interactions between your application and the sql calls being made.
In future posts I will show you how to create your own data collectors. For now please try out this data collector and others and let us know what you think.
Comments
- Anonymous
August 24, 2014
I am using Visual Studio 2012 but the profiling option is not visible. Please help what can be possible reason.