The hidden tool - MSDTC Transaction Tracing
If you deal with MSDTC frequently, you might have noticed an option to toggle the tracing options for transactions in the MSDTC settings but I am not sure how many are really aware of what information is logged inside the trace file and how the trace file can be converted from a binary format to a text format. The built in transaction tracing is one of the least famous (but yet a very powerful) feature of MSDTC diagnostics. This tracing logs information about various stages of transaction propagation and gives you enough information about the various outcomes of a transaction. Using this tracing, you can not only determine the various transaction managers or resource managers involved in a transaction but you can also determine the cause of a transaction abort.
The transaction tracing becomes a powerful tool when the transactions are either taking too long to run or they are getting aborted intermittently and nothing inside your application is giving you any hint around why the transaction is getting aborted. If you observe one of the following errors inside your application, I recommend using the MSDTC transaction tracing to figure out more details about your transaction
- The Microsoft Distributed Transaction Coordinator (MS DTC) has cancelled the Distributed Transaction
- The transaction has been implicitly committed or aborted
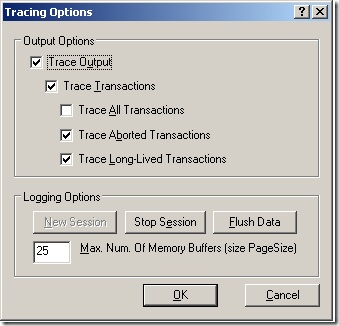
By default, only the long-lived transactions are traced. You can turn ON tracing for all transactions or aborted transactions based on the kind of issue you are troubleshooting. You just have to select the relevant checkboxes in the trace settings and tracing will take effect (no restart of MSDTC service is required to toggle these settings)
The next important thing becomes collecting the trace in the right manner. It is always better to collect a trace which just contains information about the problem that you are troubleshooting because on a busy server the Transaction trace can contain a lot of transactions and it might become very difficult to find out which transaction outcome you are interested in. So this is how we like to collect a DTC Trace.
- Open up COMPONENT SERVICES and go to the properties of My Computer. Under the MSDTC tab, click on Tracing options. After that, click on Stop Session and then click on New Session button. This will generate a new file inside c:\windows\msdtc\trace folder with name like dtctrace.log.2008-12-03-11-04-52-0226-00. So this file would basically contain information about all the transactions which have already been traced up to this point and now a new session of MSDTC trace has been started which will start capturing the Tracing information as soon as you click New Session.
- Reproduce the problem inside the application.
- Now go back to the same dialog and click on Stop Session and New session. This will generate a trace file which should contain only the information about the transactions which were running while the issue was being reproduced. If your application is the only application using DTC, you can expect this log file to contain information about your transactions and analyzing the trace would be an easy job. If there are other transactions which were also running while the trace was turned ON, those will also be logged inside the file and looking at the transaction information you will have to figure out which transactions were initiated by your application.
The MSDTC tracing is basically built on the ETW Tracing for windows and like every other ETW trace, it is a binary file which needs to be parsed using some tools. Once you have got the DTC trace log file, you have to use two utilities inside the Windows XP Service pack 2 Support Tools (Tracefmt.exe and traceprt.dll) to parse the trace file. The sad part is that to get these utilities, you need a Windows XP machine because you can only install the Windows XP Service pack 2 Support Tools on a Windows XP machine. But after installing the setup (make sure to choose the complete version of the setup) , you can copy the Tracefmt.exe and traceprt.dll from “c:\Program Files \Support Tools” directory to any operating system . To keep things easier, I always copy these two files to c:\windows\system32\msdtc\trace folder.
The command used to parse the trace file is
msdtcvtr –tracelog <NameofTheDtcTrace.log> –o OutPutFile
Running the above command will parse the binary trace file and generate a text file with the name OutputFile.csv which can be opened up in any text editor.
Important things to note regarding MSDTCVTR command
- MSDTCVTR batch file launches TRACEFMT.exe in the background passing the name of the DTCTRace.log file as one of the parameters. The TraceFMT.exe in turn uses tracerpt.dll to parse the trace file.
- TRACEFMT uses a MOF file called msdtctr(present in the same (C:\Windows\SYSTEM32\Msdtc\Trace) folder to parse the trace. This MOF file varies from operating system to operating system. If you run the MSDTCVTR command without the MOF switch, the MSDTCVTR.BAT file automatically picks up the C:\Windows\SYSTEM32\Msdtc\Trace\msdtctr.mof file and parses the trace as per this MOF. This means that if you collect a trace from a Windows 2003 machine and try to parse it on (let’s say), a Windows XP machine, the parsed output may be blank. To fix this problem, you can copy both the MSDTCTR.MOF file along with the DTC Trace file, that you collected earlier, to the machine where you are going to parse the file and while running the MSDTCVTR command, pass a -mof <filename> switch to obtain the right output.
- The time shown in the parsed output is as per the time zone of the machine where you “parsed” the trace file. This can become a bit confusing if the machine where the trace is collected and the machine where the trace is parsed are in a different time zone. So let’s say, you collected DTC trace on a machine which is in the Central Time zone and you are parsing the trace file on a machine which is in GMT time zone, the time field in the parsed output will be in the GMT format.
A Quick Walkthrough
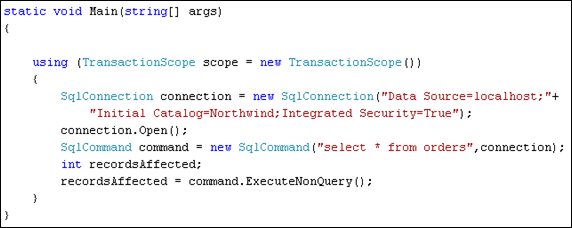
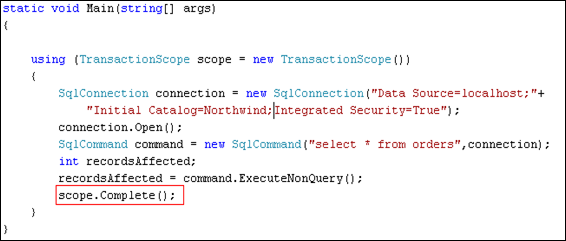
To demonstrate the right way to collect a trace and to parse the same, I created a sample application using System.Transactions in .NET 2.0 and I am running the following code
The code is pretty simple. I am just running a Select statement inside a TransactionScope and when the scope is disposed, I am expecting a Transaction to commit. But what I notice is that after I run the above code, my transaction is getting ABORTED (Anyone familiar with System.Transactions should be able to figure out what’s wrong in the above code snippet which ending up in Transaction abort )
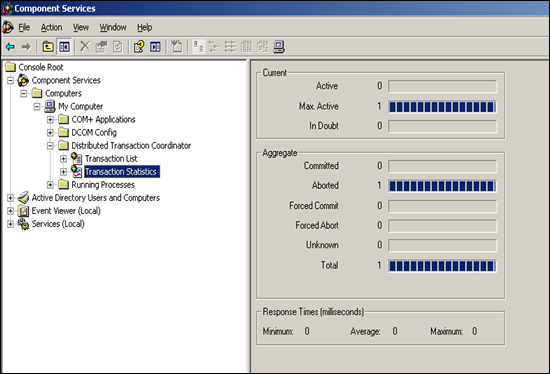
So under the transaction statistics in component services where as I expected the Transaction to commit, I can see that the transaction aborted.
Now being the application developer I might think that MSDTC is doing something wrong to my transaction. Well let’s just see what is happening in the background by turning ON some tracing. So I went inside component services and pulled up the MSDTC Tracing options and configured the tracing to trace for aborted transactions in this way
After doing that I clicked Stop Session and New session to ensure that we have a new tracing session which will log all the transaction activity from now onwards. The moment I did this, a new file is generated in the c:\windows\system32\msdtc\trace folder.
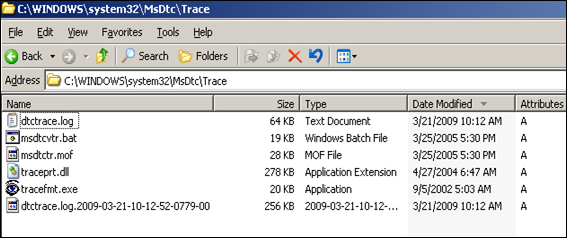
At this point, we will just ignore this newly created file as it can contain information about other transactions which might have ran in the past in which we are not interested. After this I re-ran my application and made sure that the transaction did abort and now I come back to the tracing options tab and click on Stop Session and New Session again. At this point, this is how the c:\windows\system32\msdtc\trace folder looks like.
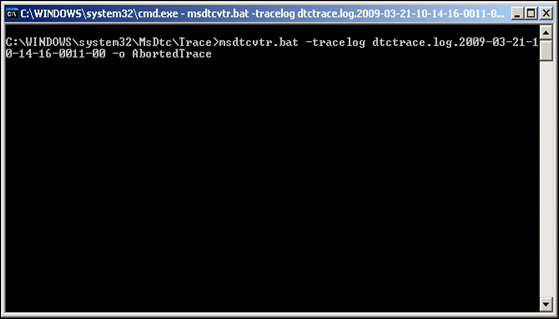
Notice that we are interested in the second file that was generated (dtctrace.log.2009-03-21-10-14-16-0011-00) as that will contain information about the aborted transaction. Now we can parse this file using the MSDTCVTR batch file
After parsing the file we will get the parsed output inside AbortedTrace.csv file and we can open it up in notepad to see what it contains. This is how the file looks like
     pid=1052       ;tid=1128       ;time=03/21/2009-10:14:05.246   ;seq=14         ;eventid=TRACING_STARTED                          ;;"MSDTC is resuming the tracing of long - lived transactions"
    pid=1052       ;tid=1128       ;time=03/21/2009-10:14:05.246   ;seq=15         ;eventid=TRANSACTION_BEGUN                        ;tx_guid=35e57abd-1782-4fe2-ae59-01ffb0e9b628     ;"transaction got begun, description : ''"
    pid=1052       ;tid=1620       ;time=03/21/2009-10:14:05.246   ;seq=16         ;eventid=RM_ENLISTED_IN_TRANSACTION               ;tx_guid=35e57abd-1782-4fe2-ae59-01ffb0e9b628     ;"resource manager #1001 enlisted as transaction enlistment #1. RM guid = '5f9d03ca-2f03-49cf-9b17-7cb7962f0ef0'"
    pid=1052       ;tid=1128       ;time=03/21/2009-10:14:05.261   ;seq=17         ;eventid=RECEIVED_ABORT_REQUEST_FROM_BEGINNER     ;tx_guid=35e57abd-1782-4fe2-ae59-01ffb0e9b628     ;"received request to abort the transaction from beginner"
    pid=1052       ;tid=1128       ;time=03/21/2009-10:14:05.261   ;seq=18         ;eventid=TRANSACTION_ABORTING                     ;tx_guid=35e57abd-1782-4fe2-ae59-01ffb0e9b628     ;"transaction is aborting"
    pid=1052       ;tid=1128       ;time=03/21/2009-10:14:05.261   ;seq=19         ;eventid=RM_ISSUED_ABORT                          ;tx_guid=35e57abd-1782-4fe2-ae59-01ffb0e9b628     ;"abort request issued to resource manager #1001 for transaction enlistment #1"
    pid=1052       ;tid=2572       ;time=03/21/2009-10:14:05.261   ;seq=20         ;eventid=RM_ACKNOWLEDGED_ABORT                    ;tx_guid=35e57abd-1782-4fe2-ae59-01ffb0e9b628     ;"received acknowledgement of abort request from the resource manager #1001 for transaction enlistment #1"
    pid=1052       ;tid=2572       ;time=03/21/2009-10:14:05.261   ;seq=21         ;eventid=TRANSACTION_ABORTED                      ;tx_guid=35e57abd-1782-4fe2-ae59-01ffb0e9b628     ;"transaction has been aborted"
A careful review of the above file gives you the following information
- The transaction identifier for our transaction is 35e57abd-1782-4fe2-ae59-01ffb0e9b628.
- The transaction started at 03/21/2009-10:14:05.246 and got aborted at 03/21/2009-10:14:05.261
- The fifth column in the above file shows the various events that happened for this transaction and the 6th columns gives a descriptive information about that particular event. So going through the above file, we can see that the event of interest is RECEIVED_ABORT_REQUEST_FROM_BEGINNER which tells us that the application which started the transaction is the one which sent an ABORT request to MSDTC for the transaction.
So from this we can infer that we are doing something wrong in our application which is sending an ABORT request to MSDTC. Upon reviewing our code and going through the documentation of TransactionScope , we can see that we missed something very important. From this article (see TransactionScope class)
“When your application completes all work it wants to perform in a transaction, you should call the Complete method only once to inform that transaction manager that it is acceptable to commit the transaction. Failing to call this method aborts the transaction.”
And the right code becomes
The above example may not be the best one to give here but I am sure it will help you understand the basics of collecting a trace and how to parse it to retrieve the right information. The MSDTC trace can contain a lot of other events as well and I am pasting here some of the most common events that we see while parsing trace files from real time customer scenarios.
| ABORT_DUE_TO_TRANSACTION_TIMER_EXPIRED | The Transaction is timing out because of the configured timeout for a transaction in DTC settings. |
| RECEIVED_ABORT_REQUEST_FROM_BEGINNER | The application which started the transaction issued an abort request to MSDTC to ABORT the transaction. In case of a transaction originating from a COM+ component, a call to ContextUtil.SetAbort will end up sending this event to MSDTC. |
| TRANSACTION_PROPOGATION_FAILED_CONNECTION_DOWN_FROM_REMOTE_TM | This error is typically due to networking issues. This happens when MSDTC on one machine loses connection with MSDTC on the other machine. For more information on this event, refer this article. |
| TRANSACTION_PROPAGATION_FAILED_TRANSACTION_NOT_FOUND | This event happens when you try to commit or abort a transaction that has been already committed or aborted. |
| RM_ENLIST_FAILED_TOO_MANY_ENLISTS | DTC already has the maximum number of resources enlisted in the transaction. The maximum number of resources that can be enlisted in a transaction is 32. More information in this article. |
