Visual Reports
Hello everybody. I’m Heather O’Cull and I’m also a program manager on the Project team. This week I decided to lock Lidiane out of her office and take over control of the blog to write about a new feature that I think is pretty cool – Visual Reports.
Visual Reports is a new feature in Project Standard and Professional that allows you to report on your project’s data in Excel using PivotTables and PivotCharts, and in Visio using a new feature called PivotDiagrams (think fancy WBS charts). Using Visual Reports you can now easily create eye-catching reports that are also informative off data from your project using formats that are familiar to your target audience. To help get you started we are shipping Excel and Visio templates. You can also create your own templates that you can share out to others to provide a consistency across everyone’s reports.
Some background information for the technical people (non-techies feel free to scroll to the pretty pictures), Visual Reports works by first creating a local database (.mdb file) that contains data from your project. From there we build a local cube (.cub file) and then hook the cube up to a PivotChart in Excel or a PivotDiagram in Visio. These cubes are completely separate from the server cubes. There are six different cubes to create reports off of – resource, task, and assignment in both summary and usage (time phased) flavors. You can even save cubes or the database to then create reports off of in the future.
And now for the pictures…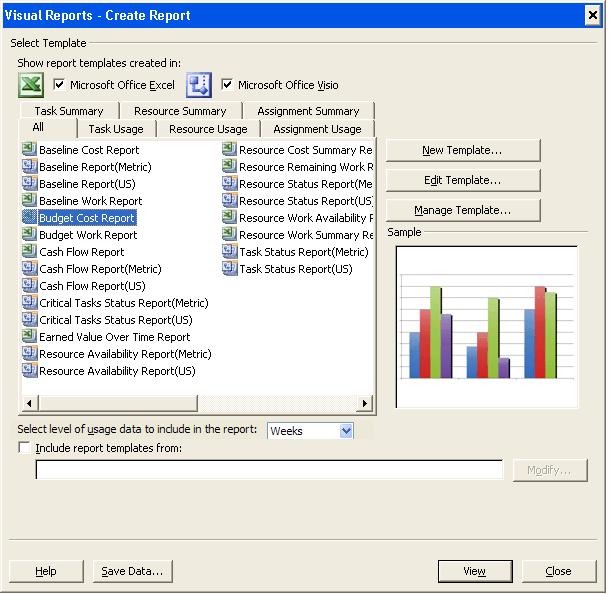
(Click to enlarge)
Pictured here is the main Visual Report dialog. All of the templates you see listed in the dialog are templates that we are shipping to help get you started. If I create a new template and save it in my templates folder it will also show up here. You can even choose to include templates from another location such as a public share. When you create or edit a template you can specify which project fields and custom fields to include in the template.
Here is an example of an Excel template we’re shipping, the Resource Work Summary Report:

(Click to enlarge)
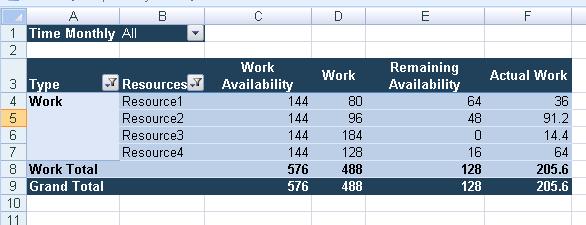
And the corresponding PivotTable:
(Click to enlarge)
Note, how using this chart you can easily see that Resource3 is over allocated and that Resource1 and Resource2 could potentially take over some of its work since they both have remaining availability. If I wanted, I could customize this report to only show the data for a certain time period. I’ve also customized the look of the chart a bit to help show off Excel’s new charting capabilities. For more information on new Excel features check out the Excel 2007 blog.
As I mentioned earlier Visual Reports works with a new feature in Visio called PivotDiagrams. These diagrams are good for hierarchical data such as work breakdown structures. You can customize the look of the nodes in the diagram by adding text fields, data bars, indicators, and background colors that are based off a value. You can even use formulas to create calculated fields in Visio. To learn more about this feature check out the Visio 2007 blog. Here is an example of the task status report:

(Click to enlarge)
From here I could drill into Phase3 to see which tasks are causing it to slip.
And for a little more background information, Visual Reports works with Excel 2003 or later and Visio Professional 2007. You don't need to have .Net 2.0 installed to use this feature. That was only a requirement for the Beta.
Comments
- Anonymous
May 23, 2006
Hi Heather,
is there any chance to analyze data with visual reports beyond the running project? This means could a project manager see data from his projects without seeing all data from all projects in the company? It would be great to use this feature as a workaround for the problem, that the PWA Data Analysis enables access to corporate project data.
I am looking forward to hear your response!
Rayk - Anonymous
May 24, 2006
The reports you create through Visual Reports contain data from the project you are currently reporting off of in the Project client. So if you want to create a report off of Project A, B, and D, but not Project C, you could insert A, B, and D into a single project and then create a report off this project. The report would contain data from projects A, B, and D.
Let me know if this doesn't make sense or if you have additional questions.
Thanks,
Heather - Anonymous
June 05, 2006
I'm a developer who being using Visual Reports for year now. Is this the same Visual Reports that Sparrow Technologies offers? - Anonymous
June 05, 2006
I saw that you offer Visual Reports within MS Project. Is this the same Visual Reports I use in my VB and Excel application?
I've started using Visual Reports for .NET, will my report definitions work in the MSProject version of Visual Reports?
I'm hoping it will so I can build one set of reports that work in my .NET application as well as in my Excel applications. - Anonymous
June 05, 2006
I almost forgot, the version I'm also using is from Sparrow Technologies, not sure if there the same.
http://www.sparrow-technologies.com/products.html - Anonymous
June 05, 2006
Visual Reports is the name of the new reporting feature we added to Project 2007. It is completely separate from the Visual Reports feature you are referring to.
Thanks,
Heather - Anonymous
June 06, 2006
Hi Heather,
This is confusing isn't it. I can currently generate reports in my VB and Excel applications using Visual Reports and now you have a report writer with the same name?
How is the new version of Visual Reports different or better from the one Sparrow Technologies offers?
Thanks
Gary - Anonymous
June 08, 2006
The Visual Reports feature in Project is completely different from the Visual Reports feature that Sparrow Technologies offers. The Visual Reports feature in Project allows you to report on data from your project file in Excel or Visio. Prior to this feature there wasn't an easy way to get your data from Project to Excel or Visio.
Thanks,
Heather - Anonymous
June 08, 2006
The comment has been removed - Anonymous
June 08, 2006
To use Visual Reports you must have .Net 2.0 and either Excel 2007 or Visio Pro 2007 installed (Visual Reports doesn't work with Excel 2003 in Beta2).
If you installed .Net 2.0 after installing Project, you'll need to do the following - go to Control Panel - Add or Remove Programs - select Project and click Change. Select Add or Remove Features, expand Microsoft Office Project and set the install state of Visual Reports to "Run from My Computer". Click continue to install the feature.
If you installed .Net 2.0 after installing Excel and Visio you may need to do the following. Follow the steps above to get to Add or Remove Programs and select your Excel or Visio installation and click Change. Select Add or Remove features and expand Microsoft Office Excel/Visio. Verify that .Net Programmability Support is set to "Run from My Computer". Restart Project if it was open while completed the above steps.
Let me know if you are still having issues.
Thanks,
Heather - Anonymous
June 26, 2006
Hi Heather,
Is this expanded reporting capability going to be offered with Project Server or only with Project. This type of reporting is what we have been looking for to apply to our entire portfolio of projects.
Marty Biggs - Anonymous
June 27, 2006
Kind of. On the server you can build cubes that contain all the data on the server and then report on this data using PivotTables in Excel, PivotDiagrams in Visio, and any other application which can connect to databases or cubes such as SQL Reporting Services.
The server cubes are completely separate from the cubes used in Visual Reports. Also, you can't use the report templates you create in Visual Reports with the server cubes. For more information on server cubes see Lidiane's post - Cube Building Services Overview.
Thanks,
Heather - Anonymous
July 11, 2006
Hi Heather-
I use Project 2003 daily to produce Gantt chart visual reports for upper management. It is very difficult and timeconsuming, and not at all user friendly to try to export snapshots to PowerPoint.
To save my formatting, I have one huge unwieldy file than I filter rather than linking projects. Will these issues be addressed in Project 2007? - Anonymous
July 11, 2006
Using Visual Reports, you can't create a Gantt view but you can create a bunch of other charts that upper management may be interested in.
We haven't done any work around exporting snapshots of the Gantt chart to PowerPoint this release. I'm curious though if we could figure out a way to make this process easier for you using the existing features. What part do you find difficult? Have you tried using Copy Picture (on the Edit menu in Project 2003 and on the Report menu in Project 2007) or Copy Picture to Office Wizard (on the analysis toolbar)?
Thanks,
Heather - Anonymous
July 12, 2006
yes--that is my work around, I think this is an area worth developing- I have chatted with some people at Tufte' lectures, and the use of time phase data in Visual presentations is essdential--I will send you some examples if you give me your e-mail.
it is amazing how much data can be presented by modifying the basic Gantt view in Project--I realize that Project is not designed for this use, but it could be a fantasticadvantage if it could be user friendly to do so. - Anonymous
July 12, 2006
We would love to see some examples. Thanks for the offer. Send us an email using the Email link at the top of the site, you won't be able to attach the files here but we can then email you back the address to send the files to.
Thanks,
Heather - Anonymous
July 30, 2006
We have been playing around with the visual reports, but have one requirement which we're not able to solve. We would like to create visual report templates which is automatically included in the list of default templates. This is to ensure that all the users have these templates in their default list rather than specifying a shared location on the network to which they have to point. Is this currently possible in any way?
Thanks - Anonymous
July 31, 2006
This is possible. Any Visual Reports template that is saved to this location: Documents and Settings[user id]Application DataMicrosoftTemplates is automatically displayed in the template list. Just have your users copy the files to this location.
Note that Application Data is a hidden folder, so if you don't see this in Windows Explorer you'll have to change your settings to display hidden folders.
Thanks,
Heather - Anonymous
August 23, 2006
As a consultant, I have a client that would like to use Project Professional to prepare a Collabrative Enabler for their customer.
They do not want to reinvent the wheel, but at the same time use their IT staff to "put together" a total application that will serve several departments in their client's offices as well as their office and several vendors for whom they will be responsible. All of this using the internet, Share Point, etc.
Do you have any advice for me?
Graham - Anonymous
August 30, 2006
We are interested in the reporting in MS Project 2007, but we also have some add-ins utilities we purchased for MS Project 2000 that are COM based. When MS Project 2007 comes out can we still use our COM based add-ins and the .NET add-in Visual Reports together? - Anonymous
August 30, 2006
Graham - can you give me a little more information on what you are trying to do? I don't fully understand the scenario.
John - You can use your COM add-ins and Visual Reports. I am excited to announce that in the final version of Project 2007, Visual Reports will no longer require .Net 2.0 (for the Betas you'll still need to install .Net 2.0).
Thanks,
Heather - Anonymous
September 02, 2006
Will Visual Reports work for previous version of Project, such as 98, 2000 and 2003. - Anonymous
September 02, 2006
Where can I download the beta version, so I can look at the new features? - Anonymous
September 05, 2006
Visual Reports is a new feature in Project 2007. You must have Project 2007 installed to use it.
You can download the Beta from http://www.microsoft.com/office/preview/beta/getthebeta.mspx?showIntro=n
Thanks,
Heather - Anonymous
September 13, 2006
Heather
I tried the link you listed and after getting myself setup with the login, it was asking for me to pay for the download.
I don't want to pay for this beta version, is there another way I can receive the beta without paying a fee for it?
Thanks
John - Anonymous
October 04, 2006
Hello Heather, This is a great resource. Any chance to get a little more information on:
- Modifying and saving templates for visual reports?
- Modifying formulas in existing templates? Thanks! --Mark
Anonymous
October 08, 2006
Can you help me? please tell me how do I get a topic referns visual report, for example what is it?Anonymous
October 18, 2006
I'm interested in doing some reporting from MSProject and I ran across a beta version of Visual Reports for Microsoft Project at Sparrow Technologies website. I enter myself into the beta program, but is this the same beta program as listed here at this site. Not really sure. http://www.sparrow-technologies.com/products_2.html Let me know. Thanks FrankAnonymous
November 20, 2006
For a response to 'Melissa' about less cumbersome Gantt charts... I copy tasks -> paste into a seperate file -> format gantt accordingly -> print to PDF (Acrobat Standard required)... seems to work for me much better than the 'copy picture' functionAnonymous
January 05, 2007
The comment has been removedAnonymous
January 29, 2007
Hello Heather, hello community, I have one little question to the new feature visual report. is there any documentation how to create a new template for the local report library of project professional? and can I add such a template to the global template too? (so is there an online library of the project server?) Thank you thomasAnonymous
January 29, 2007
Here's a link to the help topic - http://office.microsoft.com/en-us/project/HA101637091033.aspx?pid=CH100666271033 Basically, to create a new template for the report library, in the Visual Reports dialog select New Template. After you have the template created in Excel or Visio click Save. By default the save location should be Documents and Settings[User name]Application DataMicrosoftTemplates Any Visual Reports template that is saved at this location will automatically show up in the Visual Reports dialog. Alternatively, in the Visual Reports dialog you can check "Include report templates from" and then specify a location you want reports pulled in from. You can't add report templates to the global but using the above mentioned functionality you can save the templates to a file share and then have everyone point to that. Thanks, Heather BTW, I'm planning another post on Visual Reports - anyone have any suggestions for what I should talk about?Anonymous
March 12, 2007
The comment has been removedAnonymous
March 12, 2007
The comment has been removedAnonymous
March 16, 2007
Hi, I've never created a visual report before and my current employer would like to see the task summaries of a project, listed one after the other on the Y-Axis and the X-Axis to be the Duration and Actual Duration shown for each of those task summaries. I tried playing around with it but I have not been very successful. Any help would be greatly appreciated. Thanks!Anonymous
March 18, 2007
There are 2 ways to create this report. If you have Excel 2007: Open the project in Project and go to Report-Visual Reports. Click New Template and select Task Summary for data type. Switch over to Excel once the template is created. Check tasks in the field list and expand this until it is at the level you want. Click on a task and right-click it. In the right-click menu, go to Show Properties in Report and select duration and actual duration. Now you (hopefully) have the data you want. To graph this highlight the cells you want and paste these into a different part of the Excel worksheet. You can now graph this data however you want. If you don't have Excel 2007: You'll have to save the project file as an Excel worksheet. Go to File - Save as and select Excel worksheet as the type. Choose to export task and when mapping fields, in the upper right corner select the summary task filter. Then choose to map the Name, Duration, and Actual Duration fields. Save this and then open it in Excel. You can now graph this data. I hope this works for you. Thanks, HeatherAnonymous
March 28, 2007
Could you confirm for me whether Visual reports with MS Project 07 Professional is compatible with Excel 03, as I am having trouble updating my pivot tables. Do I need to have excel 2007. Thanks KyleAnonymous
March 28, 2007
Visual Reports works with Excel 2003. What kinds of issues are you having? Thanks.Anonymous
March 29, 2007
The trouble I am having is automatically updating the pivot table in excel created from the Visual reports resource summary data. The new template is created in excel without trouble but after saving the template and closing Project I then reopen the excel template and try to update the pivot table with the current data and I receive the error: Cannot open cube ‘C:Docume~1kworthLocals~1TempVisual Reports Temporary Data {6ea19f4f-19c7-4f6a-865c -2e2081a15da1}ResourceTP.cub.’ If I manually try and connect to the resource cub. I saved through the Visual Reports menu I then receive a message asking me to "Please enter MS Jet OLE DB Initialization Information. Two of us have tried this on different computers with the same result. So the result is if I want an updated template I have to create a new one every time as it won't automatically update. I have posted this same problem and asked quite a few people with no suggestions at this. I would be very grateful for any help or suggestions. Thanks KyleAnonymous
March 31, 2007
Ok, I see what the issue is. Visual Reports works by creating a temporary local cube that contains data from your project. We connect that cube to an Excel pivotTable. When you close Project we delete the local cubes since they can get quite large. When you open the template up through Excel you are getting that error since the local cube no longer exists. To work with the templates you need to use them through Project. So your steps should be:
- Boot Project.
- Go to Visual Reports and click New Template to create your template.
- Set up your template however you want it to be in Excel.
- Save it.
- Back in Project, you should now see your template in the template list (switch tabs back and forth if you don't immediately see it).
- To update this template with the current data from your project, select the template and click View. Your template will now open up in Excel with the current data from your project. Let me know if you have issues. Thanks, Heather
Anonymous
April 02, 2007
Thank-you! The steps resolved the problem! KyleAnonymous
April 03, 2007
Hello, I have some troubles to generate Visual Reports on Citrix Server with Office 2003 SP2, Project 2003 SP2 and Project 2007. It works perfectly for Admins, but there is this error for standard users when they click on "view" button : "This operation requires you have excel 2003 or later installed on your computer" Any idea ? Thanks, DanielAnonymous
April 16, 2007
Sorry for the delay. I'm not really sure what's going on here. Do you have multiple versions of Excel on the machine? Make sure the user has permission to use Excel. If they do, have them try having Excel up and running and then going to Visual Reports. Does this work? Thanks, HeatherAnonymous
April 17, 2007
Thanks for your response ! It's a really a strange problem, I haven't multiple Excel versions on CITRIX server (only Office 2003 SP2), and user was able to use Excel directly. MS Support gave me a workaround : Copy the excel.exe file from office 11 to office 12 folder... I hope it can help other users :-) Thanks again, DanielAnonymous
May 09, 2007
I had a problem with Visual reports. Excel Pivot generated from MPP via Visual reports has shift in weeks. I.e. today is Week 19 but this time is shown as Week 18 in the Pivot. Any idea why?Anonymous
May 10, 2007
It looks like you are seeing an inconsistency because Project starts the year with week 1 and the timescale used in Visual Reports starts the year with week 0. Thanks for reporting this inconsistency.Anonymous
June 09, 2007
Hi, Can i generate reports only with the project name, % complete, start and end date . If i have say 20 projects and immediately i need status can i customise and build reports to show this view , pls let me know if its possible thru sharepoint that is being used in project 2007Anonymous
June 19, 2007
Hi. Visual Reports have changed my life! I have found a strange behaviour, which fortunately I'm able to work around. But I would like to know if you know what might be causing it. If I use the same visual report template twice or more times, values get duplicated or more. If I choose to view a report, and after that I change anything in project information, I need to close the project and open it again. Otherwise , viewing again the report will bring wrong values, two times or four times the real values. Thank you, sorry I should be posting this in a forum, but this blog was really good and specific on visual reports issues.Anonymous
August 22, 2007
Hello Heather How to include custoum fields in reports. The standard way I use Visual Report (custom) fields are no shown in the Excel 2007 Pivot table.Anonymous
September 17, 2007
Looks like I've been quite slow on answering questions - Srinimax, to create that report you would want to either create a custom server view or use server reporting. Visual Reports is much better for reporting on a single project or master project. Noela, Glad you like Visual Reports and sorry you are having problems with it. I'm unable to reproduce the bug you are seeing. Could you email me more detailed steps? You can use the email link at the top of the page. Hans - If the custom field isn't a dimension (a custom field with a lookup table) or a measure (a custom field that is rolled up), then the field won't be listed with the others on the right. To get to it, you'll need to add the task or resource dimension to your pivottable. Click on a task/resource and right-click it. In the right-click menu, go to Show Properties in Report and you should see your field there. Note, this will only work in Excel 2007. ThanksAnonymous
October 03, 2007
I can see how you create the visual reports, however how do you convert the reports into a workbreakdown structure in Vision.Anonymous
October 03, 2007
I want to create the WBS as you have done in your example, please be so kind as to give me the step you do to create the WBS from project into visio.Anonymous
November 06, 2007
In Project 2007 I am trying to create a simple set of s-curves for the baseline % complete and actual % complete based on task duration(I have no costs assigned to tasks). This should be a very simple report but there does not seem to be any way to do it. First, there does not seem to be any way to calculate the baseline % complete and, second, when I try to create a template for a new report, it keeps on insisting on having cost data in the report. Also, I note that when I do have cost data (I inserted a fixed cost for each of the tasks), the earned value report contains only zeros (well, almost all zeros .. the only variable that does have numbers in it is the "cost"). Even the Cummulative costs come up as zeros. Planned and actual earned values are blank. Interestingly enough, when I look at the task usage table, the "baseline costs" are there as are "costs" and "cummulative costs". [I note that there is no cummulative baseline cost anywhere.] Suggestions?Anonymous
November 09, 2007
I've installed Project 2007 and Visio 2007, and I have two problems. The first is that I don't have the visio templates, just the excel templates. The second problem is that when I go to Visual Reports and try to create a new Visio Template the application tells me that I need to have Visio 2007 installed. I've uninstalled and installed it three times with the same results...any ideas?Anonymous
November 12, 2007
Hi, Do you need to have Visio Professional to use/get the templates? I don't seem to get them with Visio Standard.Anonymous
November 26, 2007
Hi Heather. Not sure if you're still monitoring this thread... Can you help me understand why I see data in Visual Reports which I don't see in Data Analysis in PWA? Specfically, I'm using the Assignment Usage data in Visual Reports, but cannot find this info in the OLAP cubes leveraged by Data Analysis. Am I missing something obvious? Thanks! PHEAnonymous
November 26, 2007
The comment has been removedAnonymous
December 03, 2007
The comment has been removedAnonymous
December 03, 2007
Hi Heather, I'm specifically looking at Assignment Usage data. Is this too project-specific to work at the portfolio level of Data Analysis in PWA? Thanks! PHEAnonymous
January 16, 2008
Hi Heather, I have some problems with the visual reports in Project... Let's start with the simpliest ;) I have created a new local projectplan with local resources in Project client. Then I created my own report where you can see on a weekly base the different projects which a resource is allocated to. The problem ist that by the transfer of the data from project client to excel every work-assignment ist multiplied by 3... So I get for every resource that has a daylimit from 5 per week in project client a value from 15 in excel!?! Is it a bug or is there a simple solution? What have i done wrong? Thanks MarcusAnonymous
January 20, 2008
Hi Heather, You have mentioned a weeknumber inconsistency. Week 1 is numbered as Week 0. have you any idea when this is fixed? Will it be part of the roll-up fix that is forthcoming? Thanks, PeterAnonymous
January 28, 2008
Peter - This issue wasn't fixed in SP1. The only workaround I have for you is to manually renumber the weeks in Excel. Marcus - I'm trying to reproduce the issue you're seeing. Are you using a resource pool? It sounds like you have a master project with multiple projects inserted into it - is that correct? Thanks, HeatherAnonymous
February 09, 2008
Hi, I would like to add to the pivot of "Resource work summary report" the dimentions of "project" and task name, is that possible?Anonymous
February 09, 2008
Hi, I am trying to edit the template "resource work summary report" and add the "tasks" to the cube. Unfortunately I don't see this field in the "filed picker", could you please aasist?Anonymous
February 20, 2008
Hi Heather, Question simalar to the one from Marcus on 17 Jan. When I try running a visual report off of a Master Project that has 3 linked projects which are linked to one resource pool - the Resource hours reported on the Pivot table do match what I see in the Resource Usage View of the Master Project. For example: Resource 1 in MSP = 88 hours total, yet in Excel Pivot Table the hours = 352. Resource 2 in MSP = 120, in Excel = 480. (FYI - Using Excel 2003). The only way to get the numbers to match is to create a new Master Project and insert the 3 projects - but deselect the "Link to Project" Option. Is this the only way? Thanks!Anonymous
February 20, 2008
Hi Heather, 2nd Question: When generating Visual Reports, is there anyway to get the "raw data" to show as a separate tab in Excel. We need to be able to forward the Excel sheet onto people in accounting who want to manipulate the Pivot Table and are asking for the "raw data" to appear in the workbook - similar to how Pivot Tables normally work in Excel. Is there any way of getting the data out of the cube? Thanks! MarkInSFAnonymous
February 21, 2008
Re: Creating visuals of deliverables across multiple projects Heather, We want to create a visual of deliverables for each project, showing the links between projects. Can MS Project Server 2007 do this? Thanks, RitaAnonymous
February 24, 2008
Heather, Nothing happens when I click Report, Visual Reports in MSP 2007. I am running MSP2007Pro build 12.0.4518.1014 and MS Excel 2003 on a Windows XP Home SP2 machine. When I had MS Excel XP and not 2003, there was a message requestiong MS Excel 2003 to be installed; so I did, and the VR were working. And now, nothing at all; I have checked everything you mentionned earlier aboout .NET, installed again and again MSP and Excel, stiil nothing. Can you help? Thank you, AlexandreAnonymous
February 25, 2008
The comment has been removedAnonymous
March 05, 2008
Hi Heater I have a task cost custom field that I want to use in the baseline cost report (assignment usage) however i can not manage to find it when i try to use the field picker How can i overcome this?Anonymous
April 01, 2008
Hi Heather, Am a user of Project 2003 and i love the features in it. Can you give a general user scenario for: How this Visual reports can be useful for a user who is previously using 2003. I mean which feature in 2003 is replaced by Visual reports in 2007.Anonymous
April 18, 2008
Hello all, In relation to Hani's comments (March 12, 2007 8:01 AM) and Edwin's comments (November 7, 2007 4:33 AM) I would like to add the following: When you want to use the EV in MS Project 2007 having both fixed costs and resource costs, this is what happens: The BCWS (=PV) is calculated in the Earned Value Table including both fixed costs and resource costs. However, when you go for "Visual Reports">"Earned Value" the Planned Value (PV) displayed gives only resource costs and ignores fixed costs. So your problem is probably that you are using fixed costs. The question is can we have the right visual representation when we use only fixed costs?Anonymous
April 21, 2008
The comment has been removedAnonymous
May 27, 2008
The comment has been removedAnonymous
May 29, 2008
Heather, From what I can tell there are some very useful reports in the old report engine that are not in Visual Reports. Will the old reports get ported to Visual reports? Thanks ChrisAnonymous
July 13, 2008
Hi I have noticed thta visual reports woks ok with masterproejcts as long as you don´t have more than 6 sub projects in your masterplan - Is that correct and by design - or....???? If we have more that 6 subs, Projects shuts down saying something like - MS Proejct has encountered an unexpected error and wil be shut downAnonymous
July 25, 2008
Hi! I'm having some problems with Visual Reports of Project2007. I have a masterplan that includes several SubProjects inside and when I try to use visual reports i receive "unknown error" everytimes. I have .net correctly installed, just as Visio and Excel and averything i think... i already tried your advice to turn it on on control panel and it still persists... I think the problem is connected to have more than on subproject.. because when i open a new project i can export visual reports to excel or visio without problems.. can u help me to solve this? Thanks!! AndréAnonymous
August 12, 2008
The comment has been removedAnonymous
September 19, 2008
I am trying to see a visual report of 9 months. Work is only done Monday-Friday. When I do a visual report, it shows weekend dates, which affects my graph because every 5 days, the graph goes back down to 0 (No work done on weekends). How do I get around this? Thanks, DaveAnonymous
September 23, 2008
Mark - Custom fields aren't available in the assignment cubes. This is a limitation of the feature. Dave - I don't really have a good answer for you. If you report at the week or month level you won't see this issue or if you want to report at the day level, you'll have to go through the Year dropdown and un-check all of the weekends.Anonymous
October 16, 2008
Hi Heather, I am also having a problem with display of cummulative EV over time. I set up my project using MSP98 which did not have a sophisticated reports system for EV analysis, so I track it in Excel. But MSP2007 will not provide me the cummulative EV data that I was able to extract in MSP98. Several previous questions address this issue, have you got a fix yet? LarryAnonymous
October 17, 2008
When I go to Visual Reports in MS Office Project 2007 and click on Task Summary reports it is blank. Is it possible that I dont have a full installation of MS Office Project 2007? I reloaded the CD and Browse for Templates and ist seems that I have all them installed. Where can I get task summary templates or do I create them from scratch? When I look on the Office Website they seem to have some are they canned?Anonymous
November 18, 2008
I can not determine how to include time phased data in a cube. When I select new Template and then select the fields for the cube it doesn't give me that option. I would like to graph work by week in Excel, but must be able to extract weekly data in order to do this. Any ideas? ThanksAnonymous
November 25, 2008
Kevin S. - Do you have Visio Pro 2007 installed? We don't ship any Excel Task Summary reports with Project but Visio does ship some Visio Task Summary reports. They'll show up in the Visual Reports dialog the first time you go there after installing Visio. You can always try creating a Task Summary report from scratch or just using the existing Assignment Usage reports. Those will allow you to report on tasks. J. Larry - I have seen issues with Earned Value reports with certain files. Unfortunately I don't have a great fix or workaround for the issue at this time. If you need to report on timephased Earned Value data, you can add the fields you are interested in to the usage views and either do your analysis there or copy/paste them in to Excel if you then want to create charts based off the values. If you don't need the data to be timephased, you can still use Visual Reports. Create a new report off the Task Summary cube and add the fields to the report that you need EAC, SV, etc. Then once you are in Excel, check Tasks and expand to the desired level. Then right-click a Task, select Show Properties in the Report, and check the fields. They'll now show up in the pivotTable. Thanks.Anonymous
November 25, 2008
Hi Heather, I have the same issues than Lene Grooss. I'm running multiple projects with a pool. When I try visual Report with more than 6 in my master project, I get a fatal error. Any advise? Thanks, FranckAnonymous
November 25, 2008
LB - The Budget Work Report which is included with Visual Reports will show you how to graph work by weeks. It is off of the assignment cube but that just means you can drill in to the data either by tasks or resources. When you first use the report, you'll see data at the Quarter level but you can then expand the quarters to view weeks. Also, this report has a few other fields checked besides work, but you can easily uncheck them on the Assignment Usage sheet (that's the name of the Excel tab with the pivotTable). Alternatively, you can create a new report off the Task Usage cube. (Before going to New Template, make sure on the main Visual Reports dialgog, "Select Level of Usage data to incluce in report" is set to weeks. Once the reprot is created in Excel, in the fields list, check Work and Time Weekly Calendar. You should now see work by week once you expand out the calendar. Thanks.Anonymous
December 10, 2008
For Microsoft Project 98/2000 users, I ran across another reporting product called Visual Reports for MSProject. Nice feature is it prints reports to your printer or to PDF file. http://www.sparrow-technologies.com/visualreportsp.aspx ThanksAnonymous
December 22, 2008
I am trying to create a simple visual report for a client that shows hours or days per month per resoure for any project they work on (ie I am using Visual Reports out of a Master project). I cannot seem to find Months as an option for the timescale. Are the only options weeks then Quarters?Anonymous
January 20, 2009
By default the reports are created with data at the weeks level. To report at the month level, in the initial Visual Reports dialog, set "Select level of usage data to include in report" to months or days. You will now be able to report at the month level. Thanks.Anonymous
January 26, 2009
Heather, the Earned Value over time report is great but we would like to show the SPI and CPI values as well. Since these pivot tables come from a cube there is no way to insert a formula. Any suggestions?Anonymous
March 06, 2009
Hi Heather, I'm getting the same problems that lots of folks are having with Visual Reports and Subprojects. First, If I try to create a visual report with my master project open AND the shared resource file open, then Project crashes every time. Second, If I close the shared resource file, then I can create a Visual Report in Excel, but all of the work data is many times what it should be (same problem as others have reported here). Is there a fix to the incorrect Excel Pivot table with multiple subprojects problem? I am using all Office 2007 products (Project, Excel, Visio, etc.) Thanks, DanielAnonymous
March 13, 2009
Heather, I am trying to do a very basic WBS chart. Running Project Pro 2007 and Visio Pro 2007, so I am using Visual Reports. I just need the Name Field and the WBS field to be included in the Chart... however, I can't seem to locate the Name field in the field picker, when trying to create the report... can you help??Anonymous
March 13, 2009
The comment has been removedAnonymous
May 19, 2009
Hi Heather, I am trying to generate a simple resource usage visual report. I wish to filter/sub total resource usage correlated to custom Task field. Also, can I sort task usage by resource group? Can you help? Thanks RoyAnonymous
May 22, 2009
you state "Visual Reports works by first creating a local database (.mdb file) that contains data from your project". How do you do that? I could in Project '03 but not in '07.Anonymous
June 02, 2009
I have entered percentage completion value for each task. Through 'analyse timescaled data in excell' when i plot graph, values of total percentage completion is comming zero, hence graph shows zero for all days. same is problem with cummulative percentage completion. so how do i get graph of cummulatve percentage completion vs days through m s project?Anonymous
June 04, 2009
Heather, Whenever I try to run Visual Reports with a Master Project Plan with more than 6 sub-projects, Project Crashes. I notice their are multipe posts above about this problem. Is there a fix for this yet? BarbaraAnonymous
June 29, 2009
Thanks for the post! Is there any way to include task notes in one of the reports, like "task usage summary"? I have a master project of multiple projects and need a detailed view of task, work, actual work, resource name and task note. Is pulling the notes into the report possible? Thanks!Anonymous
July 10, 2009
@Barbc et al... Same problem here. I managed a large number of projects and can't run visual reports on them due to Microsoft Project crashing anytime I try to run a visual report on the Master Project...Anonymous
July 11, 2009
it appears that ms project 2007 does not plot Earned value over time for activities containing fixed cost only. for example I have one Activity A with $1000 as fixed cost I baseline it and can see earned value results perfectly right in Earned Value Table but cannot plot a graph of the same can you help meAnonymous
August 14, 2009
If I create a predecessor for a task that is a link to another project, I can run no Visual Reports at all. It fails saying that an unknown error has occured. I have Project and Office 2007. If I remove the link it runs fine. Does anybody have a way around this?Anonymous
September 23, 2009
Hi I am trying to create a report from SPI vs time according to the task but I have no clue abt how to get started. I looked at Earned Value over time report but it does not include SPI ,CPI.Anonymous
September 26, 2009
The comment has been removedAnonymous
October 14, 2009
Hello Heather, I am using MS Project for a while, but any kind of reporting I did so far by manual copy&paste to Excel and finally to PPT. Very awkward... Now, I would like to use visual reports directly to do the whole reporting a little smarter. My first use-case could be described like this:
- deliverables (to internal/external customers) are marked as milestones and located in a certain section of the project
- for each deliverable the end date is of course known and also available in the format "yearyearweekweek"
- for each calendar week the planned deliverables shall be counted (deliverables per week)
- once the count per week(s) is known this should be accumulated over project lifetime and (most important) being displayed as some kind of a "ramp-up" graph So, on the first glance this is s.th. different to the visual report templates that you provide. Can you give me some hints how to make my own template for the above use case? My MS office set-up:
- Project 2007 Professional (Server version)
- Excel 2003 Many thanks in advance! Kind regards, Christian
Anonymous
November 19, 2009
Hi guys, brief question, I am trying to add the SPI field in the already existing EV Visual Report but once in Excel I don;t see in the Pivot Table Field list.Anonymous
February 03, 2010
Heather, I'd like to report Actual Work by Week By resource By Task using the work week as a selection criteria. The rows would be organized by Resource, the only the tasks they worked on that week appearing below their name. What's the best way to make this happen?Anonymous
February 10, 2010
The comment has been removedAnonymous
February 24, 2010
I am also interested in being able to sub-total/ filter by a custom Project field in the Excel pivot table produced using Visual Reports. How do you do this? Also I upgraded to the free version of Project 2010-beta (curiousity got the better of me) and Project 2007 has disappeared from my menu options. Now when I run visual reports at all I get an 'unkwnown error'. Help please!Anonymous
February 24, 2010
Visual reports in 2010 is now not working at all for me. Please help. I get an "unknown error" message. I needed updated budget charts yesterday...Anonymous
February 27, 2010
Heather, several people have the same problem with using VR for reporting timescale data in Months. Yes, there is the option to choose months, but it does not actually work. Pretty frustrating as this is fairly fundamental, and unfortunate that they took away our ability to directly export timescaled data that was in the 2003 version to replace it with something that does not work.Anonymous
March 02, 2010
The comment has been removedAnonymous
March 04, 2010
Hi Heather My custom field that I would like to sort/ group/ filter by would be a custom text field (Text1 used for department) for example or a custom flag field. Is there a way to do this using 2007? I should have done the custom install to keep Project 2007 and 2010 on my computer but I didn't know 2007 would be removed from my computer at the time. I cannot get visual reports to work on the 2010 version at all, and I'm not sure if I should just remove 2010 and then re-install 2007? I like the 2010 version for some of the features - for example being able to easily add columns but I really need the visual reports feature. Thanks for your help!Anonymous
March 24, 2010
Is Cost Rate Table data available in any Visual Report?Anonymous
April 07, 2010
Cost Rate Table data isn't available in Visual Reports.Anonymous
April 23, 2010
I just installed the release of Project 2010 and I was so disappointed to see that the Outline field structure is no longer supported in Visual Reports. When exporting an outline fields in Project 2007 the outline structure is respected. In Project 2010 it export the field detail only without the outline structure. Changing the print options in Excel also does not work. Can you tell me when this will be fixed? Now I need to keep a project 2007 image running all the time. This was very frustrating and disappointing. Help!Anonymous
April 27, 2010
I have found that visio 2010 breaks virtual reports. Works with visio 2007 but as soon as upgrade to visio 2010 the error that you must have visio 2007 or above installed comes up when running a visual report. 544Anonymous
April 28, 2010
Are you using Project 2007? Visual Reports in Project 2007 won't work with Excel or Visio 2010.Anonymous
May 14, 2010
Hi Heather, How to create s-curve in visual report? What fields do i need for a simple small project? Regards, Sharon RobertAnonymous
July 13, 2010
Hi Heather, I've sucessfully created a task cashflow report. The project is 18 months in duration. My organization needs to see cashflow presented by quarter by fiscal year. Our fiscal year begins Oct 1st. My .mpp calendar option is set for Fiscal year (Q1) starts in Oct. I thought the database would map quarters from the .mpp fiscal year format into the pivot. This doesn't appear to be the case. Pivot quarters are grouped by calendar year. Year totals are calendar, not fiscal. In essence the table is not useful for my reporting needs. I'm kaving to go through alot to manual effort to get the data the way I need it. Any suggestions? Oh so close... JohnAnonymous
July 14, 2010
John - unfortunately the time periods in Visual Reports aren't adjustable for fiscal years and such as you've noticed. You'll have to do manual work to get the data organized in the way you need. If you are just using the chart for reporting - you could try using the month timescale and then through shapes indicate the beginning and end of the fiscal year.Anonymous
July 22, 2010
Heather, I'm running Visual Reports in Project 2007 (and Office 2007), which seemed to work fine until I installed Visio 2010. I can run Excel-based visual reports, but when I try to quit Project, I get an "Microsoft Office Project has encountered a problem and needs to close" error, which triggers a "Send Error Report" prompt (including a request for additional data). If I don't run any Visual Reports during my Project session, I can close Project without any issues. (Installed on Windows XP sp3).Anonymous
October 29, 2010
The comment has been removedAnonymous
November 30, 2010
The comment has been removedAnonymous
February 24, 2011
The comment has been removedAnonymous
March 17, 2011
Daniel, in a March 2009 post cites an issue that we have experienced as well. Daniel stated the issue as, "If I try to create a visual report with my master project open AND the shared resource file open, then Project crashes every time." Note that the problem is with MASTER projects. My company has the same issue, experienced by multiple users.Anonymous
May 19, 2011
Hi Heather, Is Visio 2010 compatible with MS Project Pro 2007 for the Visio Visual Reports? Thank you, ChristinaAnonymous
May 25, 2011
Christina - do you have Office 2007 installed or did you upgrade from Visio Pro 2007?Anonymous
July 18, 2011
Hi Heather, I noticed when I tried to insert several projects into one master project...that my visual reports only picked up on the resources from one of the inserted projects. This happens whether I use a central resource pool or not. Is there a technique I'm not using to get all the resources into the visual report?Anonymous
October 15, 2011
No plug in loaded. Must be a non std MS one...Anonymous
January 22, 2012
I can't get the CashFlow Report by month to work. Given that other users have had the same problem, sounds like it's a problem with the template. Where do I get a new template??Anonymous
January 23, 2012
The comment has been removed