Configuring Data Source Time Settings for Time Intelligence
Setting the time properties in our Data Sources lays the groundwork for Time Intelligence. Essentially, this is where we align our data sources’ understanding of time, and our understanding of time. In this post, we will discuss how to set these time properties for Analysis Services data sources as well as tabular data sources, while sprinkling best practice tips along the way.
Analysis Services Data Sources
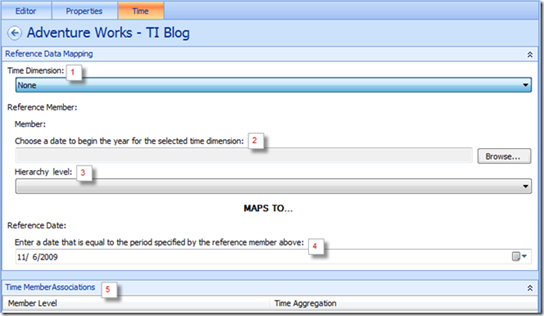
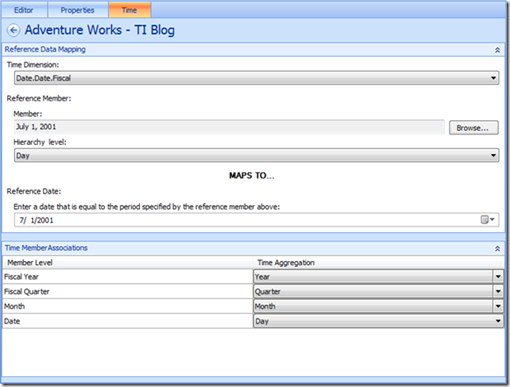
After creating our AS Data Source, we navigate to the Time tab where we are presented with the following page:
1) Time Dimension
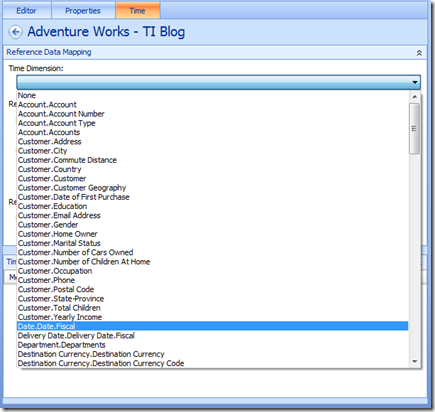
This is where we select the time dimension that we want to base all our TI formulas and functions off of – perhaps a fiscal time dimension or a traditional calendar time dimension.
2) Reference Member
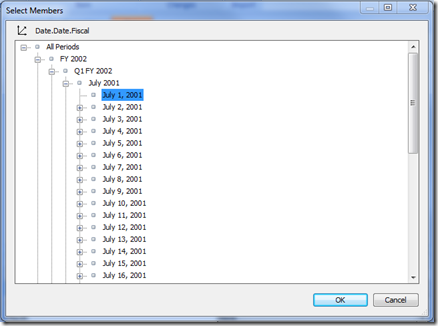
Here we indicate when our time dimension’s year starts by choosing an instance of the year’s start date. For example, if our time dimension uses fiscal years that start on July 1st, we choose an instance of July 1st in the member selector. Note that this could be titled as July 1st in the cube, or it might be represented as FY2010 H1 Q1 M1 D1, or perhaps some other format.
If we were using a traditional calendar year time dimension, we would select an instance of January 1st.
3) Hierarchy Level
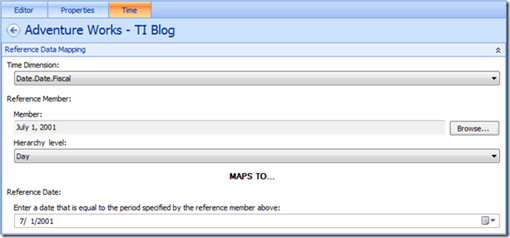
This is where we enter the granularity of the reference member – whether the member represents a day, month, semester, etc. In the above case, we would select “Day” from the drop down menu.
4) Reference Date
We enter the date reflected by the reference member in the Reference Date section. This is to map the cube’s time dimension to a traditional calendar. In our example, we would enter 7/1/2001.
5) Time Member Associations
Lastly, we map our time dimension hierarchies (listed under the “Member Level” column of the Time Member Associations section) to defined TI hierarchies (listed under the “Time Aggregation” column). Save the data source, and we’re ready to create TI formulas, filters, and links.
TI Considerations for AS Data Sources
As a best practice, we should always have the time dimensions start at the beginning of their respective year – even if that means having empty members for the first half of the year. For example, if we have a fiscal time dimension whose year starts on July 1st, but only has data recorded for Jan 1st 2002 and on, we should backpopulate that fiscal time dimension to July 1st 2001. This is to ensure all TI functions for that initial fiscal year work fully and completely.
Tabular Data Sources
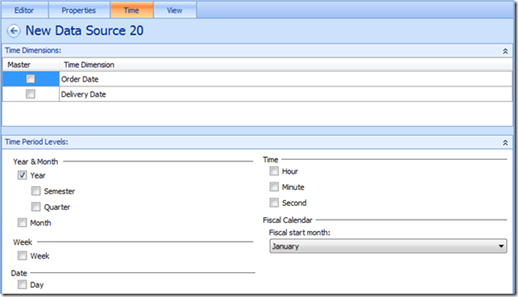
Tabular data sources, which include Excel Services, Excel Workbooks, SharePoint Lists, and SQL Server Tables, have a different set up page for their time properties compared to AS data sources. When we navigate to the time tab, we are presented with this view:
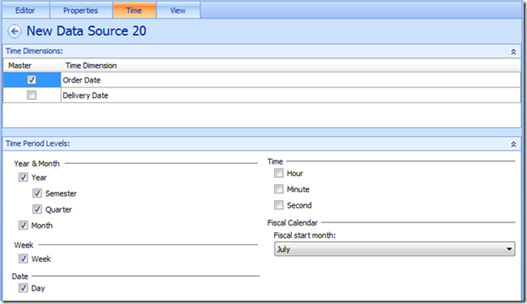
The Time Dimensions section lists the time columns that PPS has auto-detected in our tabular data source. After selecting the time dimension to base our time off of, we select the period levels that we would like to use for TI. Note that while AS data sources restricted us to time period levels inbuilt the cube’s time dimension, TI for tabular data sources allows us to choose from, and thus use functions relating to, the gamut of levels.
Finally, we select the start month of our year in the Fiscal Calendar subsection. Note that this automatically assumes the first of the chosen month is the start date for the year – if I choose July, this means that July 1st is the start of our year.
We are now ready to use the full set of TI formulas, functions, filters, and links.
TI Considerations for Tabular Data Sources
If the time dimension we want to use is not listed in the Time Dimensions section, we navigate to the view tab to preview our tabular data source. Select the date column in the preview, and mark it as a “TimeDimension” column type in the Details pane.
Semesters, quarters, and weeks are relative based on the start month, while years, months, days, hours, minutes, and seconds are absolute and based off of the traditional calendar. With regards to the year nomenclature for the relative time periods, TI treats dates before the start month as occurring in the previous year, and dates occurring after the start month as occurring in the current year.
For example, if the date is June 25th, 2008 and the start month is July, the ‘year’ is 2008, the quarter is Q1 2007, the semester is H1 2007, the week is W1 2007, the month is July 2008, and the day is July 3rd, 2008.
Kevin Fan
Program Manager
Microsoft SharePoint BI
Comments
Anonymous
February 01, 2010
Hi Kevin, I'm trying to recreate your steps but i am having trouble at the Time Member Associations step. I am unable to associate more than one mapping at the time. When i select another hierarchy the first one is replaced. Where do i go wrong ? I also use the adventureworks cube as source. When i do add the year hierarchy to the dimension and use a time intelligent function like Year and Year-1 the year shows empty and Year-1 2010. Why isn't year showing up as 2010 ? Thanks, KasperAnonymous
September 02, 2010
Can you give more details on the relationship between the reference member date and the refereence date? When experimenting with SSAS 2008R2 Adventure works cube and the fiscal hierarchy in the date dimension I see that a change of the reference date moving it away form the reference member date actually returns a date using the Day function that is older. So if I leave the member date at 7/01/06 set the reference date at 3/1/08 the Day function in the filter preview returns 2008 01 02. If I move the reference date to 3/1/09 making it a year later the Day function returns 2007 01 02 a year earlier. Same with month function. Why is that and thanks in advance!Anonymous
May 07, 2014
Hi, I have a date - Calender hierarchy in cube and in cube I have 1900 which has no data. When I am creating PPS dashboard the year 1900 showing as 0 in chart and grid. I need to remove 1900 from all the charts and grids. I am not willing to using any custom MDX query in PPS dashboard. Would you please suggest me any alternative way to hide year 1900? Thanks,Anonymous
July 23, 2015
Hello Arya, Can you guide me some about time intelligence configuration in sharepoint performance point which you have already done maybe. Please help if you have any concerned solution for this. I am using SharePoint 2013 performance point and I want to show analytical charts and grid on date range filters. If anyone have a reliable solution regarding to this, please guide. Thanks,
