OMS View Designer: Visualize your data your way
Summary: Create data visualizations with this new OMS feature.
Hey folks,
Evan Hissey here to bring you another awesome OMS feature! I’m happy to announce that the new View Designer feature is releasing to public preview today!
The View Designer enables you to create visualizations and dashboards that are powered by your OMS data as Views, much like OMS Solutions do. By using the Log Analytics Custom Logs features, Custom Fields features, and all the other data in OMS, you can use Views to build your view for what matters to you the most. Our goal for View Designer was to deliver visualization capabilities for you to use that are just as powerful as the Views you find in OMS Solutions, such as Change Tracking and System Update Assessment. We want to make sure we enable you to view your data exactly the way you want, so please be sure to mail feedback to me!
Basic view concepts
All Views include one Tile that is displayed on the main OMS Overview page. This tile can present summary information by using any one of the available tile parts. Users who click the tile see the View Dashboard that includes one or more Dashboard Parts.
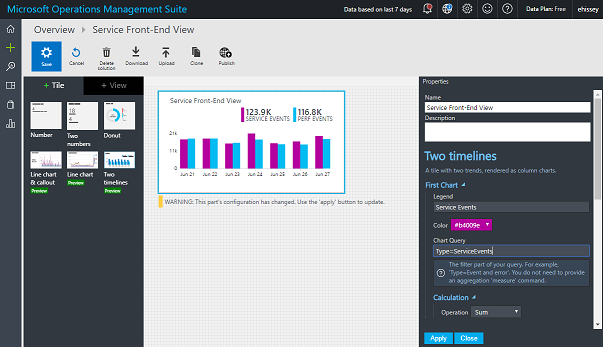
Here you can see me in the View Designer editing my View’s Overview Tile to show my service’s front-end custom events and performance data:
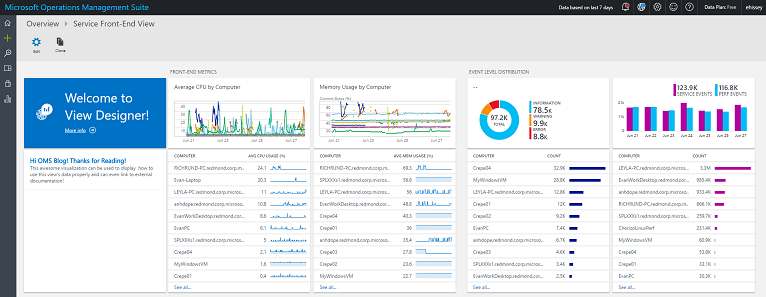
Here is my own view, complete with metrics visualized in line charts, distributions of event levels for my service, and the amount of data I’m getting for both types of events. Each visualization can drill down into OMS Log search, too!
To learn more about View Designer and all its capabilities, check out my video walkthrough!
You can watch the video here, or, for your convenience, it is also available on YouTube.
We’re really want this feature to enable you to view your data exactly the way you want, so please be sure to create suggestions on UserVoice, or even mail me feedback directly so that we can improve View Designer every day. You can interact with the community by joining the Microsoft OMS Facebook site. If you want to learn more about Windows PowerShell, visit the Hey, Scripting Guy Blog.
Get a free Microsoft Operations Management Suite (#MSOMS) subscription so that you can test the new alerting features. You can also get a free subscription for Microsoft Azure.
Evan Hissey
Program Manager for OMS
Comments
- Anonymous
October 12, 2016
In case anyone wondered, they moved the "+" icon you see on the left in these screenshots into a tile on the home screen. - Anonymous
March 08, 2017
Hey @Evan, How far back are these metrics for?

