How to enable data and log collection in Microsoft OMS
Summary: Learn how to enable logging in Microsoft Operations Management Suite (OMS).
Hello, everyone. It’s Rupanter, and we’ve had some customers ask how to enable logging in Microsoft Operations Management Suite (OMS). So, today I thought I’d take a minute to go over the available options and provide a detailed guide for enabling OMS to collect the logs that you want it to collect.
First, let’s look at the two options we have for log collection in OMS:
- Solutions Gallery
- Data
It’s important to note that these are not the same. Solutions Gallery is vast and has a lot of options that allow OMS to collect various logs from the target computer, and different solutions have different configurations that might be required. On the other hand, data collection targets more specific types of logs that we collect, such as performance logs, event logs, system logs, custom logs, etc.
Now that we have an idea of what each of these are, let's see how we can enable them in OMS and the options that each one offers.
Solution Gallery
When you view the OMS portal, you will see various options such as Dashboard, Log search, Solutions Gallery, Usage, Settings, etc. Right here. we are concerned about the Solutions Gallery.

After you click Solutions Gallery, you see a world of solutions where you can choose whatever you want to monitor or logs to collect. Be it Active Directory or Security and Audit, there are many options to choose from. For the sake of this demonstration I will go ahead and pick Azure Site Recovery.
First go to the Solutions Gallery:
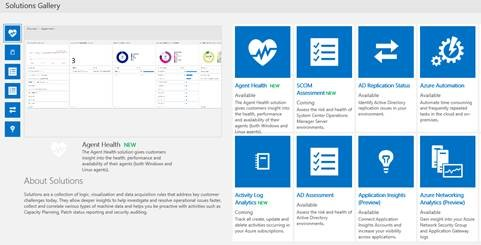
From there, select the solution that you want. In our case we’ll choose Azure Site Recovery:
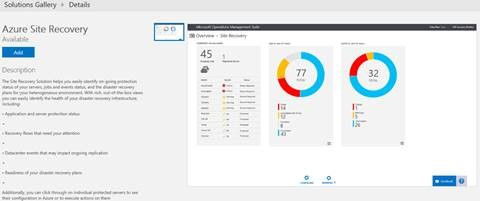
After we select the solution, there's a description of what we need for the solution and what the solution will do. It also shows an example of how the solution will look after we have added it to our Dashboard:
After we click Add, we see the Dashboard and a tile of that solution like this:
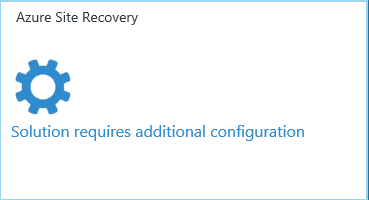
As you can see, our solution requires additional configuration, so we need to give it details in the configuration so that it can collect the logs we want. After you click this tile, OMS will ask for the needed information:
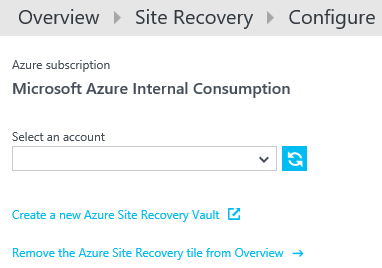
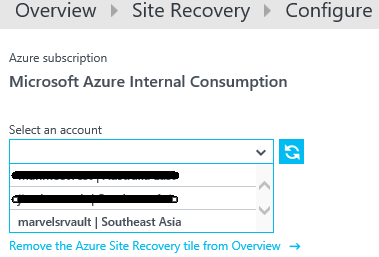
From here, we’ll scroll down and select the Site Recovery vault from where we need the data/logs:
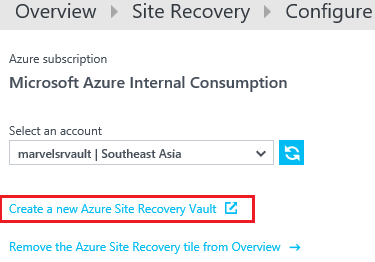
If you don't have a Site Recovery vault, you can create a new one:
For more information about the Site Recovery vault, see Replicate Hyper-V virtual machines in VMM clouds to Azure using Azure Site Recovery with the Azure portal.
After you have selected the vault, click Save at the bottom of the page. After saving, you will return to the dashboard where you can see that the Azure Site Recovery tile now looks like this:
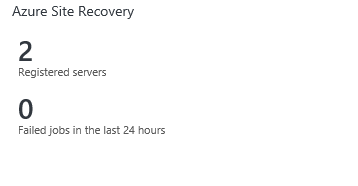
Click the tile to see the information that you need, which is similar to how it looked in the example we saw when adding the solution.
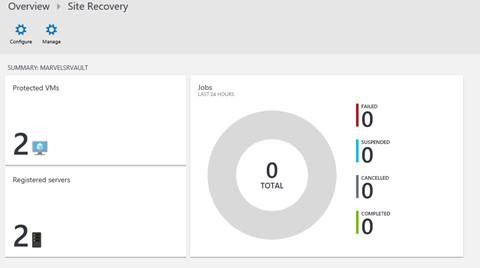
Now we have our solution deployed and data/logs are being collected! With that complete, let’s look at what our second option does.
Data
Many people assume that simply installing the agent automatically collects basic logs like event logs or system logs from a computer. That is not the case. We must enable log collection and let OMS know the logs that it needs to collect via the agent for this to work. Let's look at how to set that up:
NOTE: The agent should be installed and connected to the workspace for this to work. For more information see Connect Windows computers to Log Analytics.
First, we need to go to the Settings tile in the Dashboard on the OMS portal:
Alternatively, you can click this icon in the top-right corner of the portal:

On the Settings page, click Data:
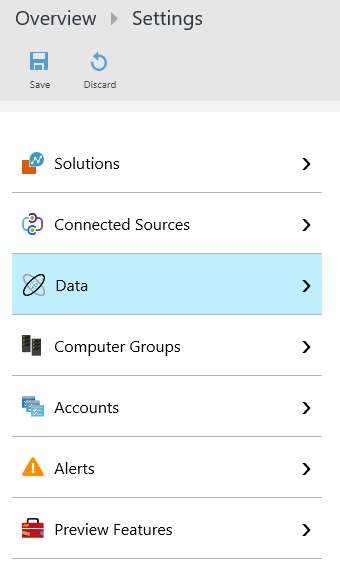
From here, we have options from Windows Event Logs to Custom Logs and more. Yes, that’s right! You can now ask OMS to collect the logs from any application just by using the Custom Logs options. For more information on custom logs, see Custom logs in Log Analytics.
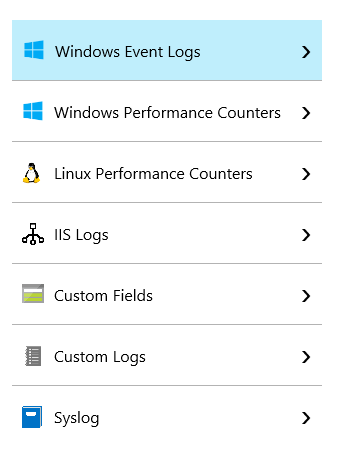
We can enable options from any or all of these depending on what we want OMS to collect logs. In our example, let’s say that we want to collect event logs and performance counters. To do that, we’ll click Windows Event Logs, and then we’ll be presented with the following:

You can specify any event log that you want OMS to collect. Just type the name of the log in the search bar and click Add:


As configured in the previous screenshot, OMS will also collect the SystemEventsBroker logs for us.
The same applies to performance counters. You can enter any counter that you want, and OMS will collect it for you. Here's an example:
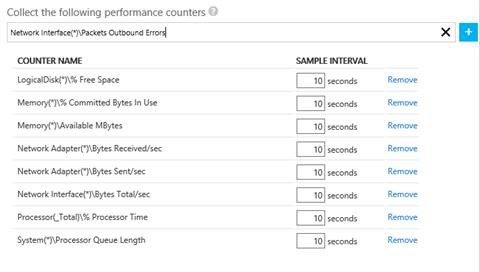
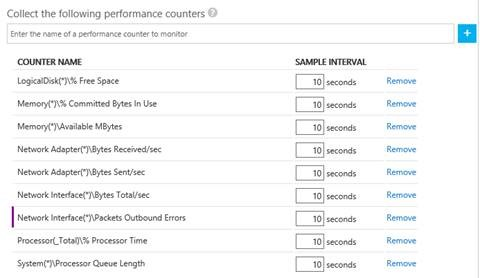
And that’s how you enable and configure Microsoft OMS to collect data and/or log files any way you want! I hope this was helpful. As always, feedback is most welcome!
Rupanter Chhabra, Support Engineer
Microsoft Enterprise Cloud Group
Comments
- Anonymous
September 29, 2016
Excellent,I want easy way for enter COUNTER NAME, LOG NAME, and for verify the name or not,Now I need to check the name with Performance Monitor, and verify the name with waiting some minutes. - Anonymous
September 29, 2016
Would be nice to actually use the ASR AB solutions with ARM recovery services...soon?- Anonymous
December 07, 2016
Hello, yes that's in the pipeline - we are working on releasing that soon!
- Anonymous
- Anonymous
October 30, 2016
Thanks for sharing! - Anonymous
November 08, 2016
What is the current minimum Interval at which the Logs are collected? How do we control it, if possible?- Anonymous
December 07, 2016
The minimum interval is 10 seconds and when you add the counters, it will ask for the "Sample Interval" - that's how we can control it.
- Anonymous
- Anonymous
December 13, 2016
I'm using OMS in ARM and want to Monitor my ARM based Site Recovery "Backup or ASR" - Currently it seems you can only monitor events in ASM when adding the solutions to the dashboard - is this a bug or is there a workaround.- Anonymous
December 14, 2016
Steve,Currently only ASM is supported but supporting ARM Backup vault is most voted feature and is coming out soon!
- Anonymous
- Anonymous
May 05, 2017
Thanks for the post. This helps me understand that I can potentially get what I need with OMS. I have to work with an admin to get access to make changes, but from this post, I don't see how to limit the log data collection to a specific set of systems, like domain controllers. It looks like this change would affect all systems in OMS.Is there a concept of "profiles" for these settings?Also, with regard to the intervals for data collection, is there any type of alert to let you know the interval is too frequent?Thanks!