Debugging web parts and other SharePoint custom code
This blog posting applies to Microsoft Office SharePoint Server 2007.
Here are some tips for debugging your SharePoint web parts and other custom code.
1. How do you debug assemblies that are in the GAC?
2. Is there an easy way of attaching the debugger to the right process?
Debugging assemblies that live in the GAC
When debugging an assembly that lives in the GAC, you have to copy the symbol file (.pdb) from your project to the GAC. The problem is, when you open a Windows file explorer to the GAC directory, C:\Windows\assembly, it doesn't behave like a folder that you can drag-and-drop into. You must copy using another method.
To view the GAC as typical folder structure using file explorer, enter %systemroot%\assembly\gac_msil in the Run... dialog box under the start menu. This folder opens the part of the GAC that contains managed code assemblies (from this location in file explorer, you can click the folder-up button to see other parts of the GAC).
From %systemroot%\assembly\gac_msil, locate the folder having the name of your assembly, and open that. Open the folder in there having the correct version number. Finally you’ll see the dll. To debug, drag the .pdb file from your bin\debug directory into that folder. You can also use an xcopy command to do this, now that you see the full path to the dll location. This path will change if you modify your assembly's version number. Note that whenever you upgrade your solution, the .pdb file is removed from that folder, so you have to copy it there again to debug again.
Of course you want to make sure to build in debug mode. Some projects are set up with dependencies on the \release\ directory, which I think is a bad idea, but it's a fact of life sometimes. If you don't want to change your build to Debug, you can quickly change your Release build to emit debug symbols: open the properties page for the project—make sure Configuration is Active (Release)—and on the Build tab, check “Define DEBUG constant” and uncheck “Optimize code” (you may also have to click the Advanced button and select "full" symbols). Now building in release mode will include debug symbols. Be sure to change these settings back once you’re done.
Attaching the debugger to the right process
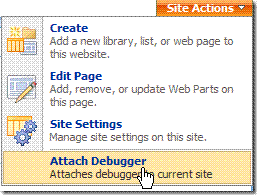
A number of people have asked me about the "Attach Debugger" menu item they see me use. This is a community feature that's been around for more than a year, but it's good to refresh people's memory of this extremely useful tool.
A SharePoint product team blog entry discusses the Attach Debugger feature that you can install for SharePoint pages. It has a link to the CodePlex project SharePoint 2007 Features that you can install to enable this feature on the Site Actions menu of your sites:
Extremely helpful! And as a bonus, it seems faster than doing it from Visual Studio's Attach Debugger command.
I recommend you look at the SharePoint 2007 Features project, it's got lots of goodies besides this.
Technorati Tags: SharePoint Development
Comments
Anonymous
September 09, 2008
PingBack from http://www.easycoded.com/debugging-web-parts-and-other-sharepoint-custom-code/Anonymous
September 09, 2008
A project on CodePlex adding a lot of value for SharePoint projects is the "SharePoint 2007 features"
