Debugging Heap corruption with Application Verifier and Debugdiag
When dynamic allocation/deallocation of memory is not handled properly by user code, this might lead to memory blocks in the heap being corrupted. There are many causes of heap corruption. Some of the common causes are: Buffer overrun (Writing beyond the allocated memory), Double free (Freeing a pointer twice) and Old pointer reuse(Reusing a pointer after being freed). The difficulty with troubleshooting heap corruption is because when a thread for instance corrupts the heap, the process does not terminate or throws an error! As long as the corrupted heap is not used, the process will not crash, but once a thread tries to use that corrupted block of memory in the heap, the process crashes! If a crash rule is active and the process crashes because of heap corruption, what we would see as a “culprit” thread that caused the crash is actually nothing more than a victim thread!
So to get to the root of the problem and find out the cause of the corruption, that is the thread that corrupted the heap, Pagegeap should be enabled. Pageheap could be enabled directly in debugdiag via a crash rule and would provide the desired results, but if you would want to get more granular information about the corruption to simplify the code fix, Application verifier could be used in conjunction with debugdiag to get such information.
To turn on pageheap for the worker process w3wp.exe and attach the debugdiag debugger host to it, here is how to do that:
First, download and install both tools:
- Download and Install Debugdiag 1.2
- Download and Install Application Verifier v3.4
- Start Application Verifier (Start --> Programs --> Application Verifier --> Application Verifier).
- Click File --> Add Application and browse to C:\Windows\System32\Inetsrv\w3wp.exe
- In the Tests Panel, expand Basics checkbox and uncheck all except Heaps
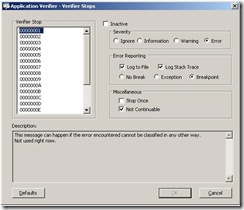
- In the Tests Panel again, select Heaps checkbox and click Edit --> Verifier Stop Options
This basically shows the stop codes that application verifier generates. The defaults actions are for all stop codes. The most important action here is the "Breakpoint" in the Error Reporting section which means that Application Verifier will call into the breakpoint exception when it detects that the heap is being corrupted.
- Start Debugdiag (Start --> Programs --> Debug Diagnostic Tool 1.2 --> Debugdiag 1.2
- Add a crash rule against a specific process.
- Type in "w3wp.exe" in the "Select Target" window and make sure the "This process instance only" check box is unchecked!
- In the "Advanced Configuration (Optional)" window, click Exceptions... and add 80000003 exception with an action type of Full Userdump.
- Finish the wizard and Activate the rule.
- Restart IIS so the new w3wp.exe loads both pageheap layer and application verifier dlls.
Note: Since pageheap is enabled per process, every instance of w3wp.exe running on the system will have pageheap on along with application verifier. There is also a performance impact associated with pageheap that would cause the processing to slow down due to heap verification.
So basically, the above configuration will make application verifier calls into the breakpoint exception when it detects that a heap operation is corrupting the heap. When the breakpoint exception is called, debugdiag will generate a full userdump. Post-mortem analysis of the userdump will give details about the corruption such as the call stack, the type of corruption, the heap address being corrupted... etc.
Here is a simple example on how application verifier calls into the breakpoint exception after detecting a buffer overrun.
0:009> kb
ChildEBP RetAddr Args to Child
0685f71c 004c3933 139f8126 02206ff8 02206ff0 ntdll!DbgBreakPoint
0685f920 004c7487 004cb5d8 00000013 0a501000 vrfcore!VerifierStopMessageEx+0x4bd
0685f944 009030f9 00000013 008f33a8 0a501000 vrfcore!VfCoreRedirectedStopMessage+0x81
0685f974 008f97aa 00000013 008f33a8 0a501000 vfbasics!VfBasicsStopMessage+0x1c9
0685f9d8 008f8ed8 0685fa00 0685fa00 0685fa10 vfbasics!AVrfpCheckFirstChanceException+0x13a
0685f9e8 7c84f937 0685fa00 0685faac 0685faac vfbasics!AVrfpVectoredExceptionHandler+0x18
0685fa10 7c813fb5 00000000 02206ff0 7c888f68 ntdll!RtlpCallVectoredHandlers+0x57
0685fa24 7c814055 0685faac 0685fac8 77bd8930 ntdll!RtlCallVectoredExceptionHandlers+0x15
0685fa94 7c82ecc6 0685faac 0685fac8 0685faac ntdll!RtlDispatchException+0x19
0685fa94 09531614 0685faac 0685fac8 0685faac ntdll!KiUserExceptionDispatcher+0xe
0685fda4 095313ef 0686de18 00000001 0686de18 badEXT!doHC1+0x24
0685fdc4 5a322991 0686de18 0686cb60 0686d7a8 badEXT!HttpExtensionProc+0x108
0685fde4 5a3968ff 0686dd90 095312e7 0685fe10 w3isapi!ProcessIsapiRequest+0x214
0685fe18 5a3967e0 00000000 00000000 0686cb60 w3core!W3_ISAPI_HANDLER::IsapiDoWork+0x3fd
0685fe38 5a396764 0685fea8 0686cb60 00000000 w3core!W3_ISAPI_HANDLER::DoWork+0xb0
0685fe58 5a3966f4 0686cb60 00000000 0685fe84 w3core!W3_HANDLER::MainDoWork+0x16e
0685fe68 5a3966ae 0686cb68 0686cb60 00000001 w3core!W3_CONTEXT::ExecuteCurrentHandler+0x53
0685fe84 5a396648 00000001 0685fea8 07e84ff8 w3core!W3_CONTEXT::ExecuteHandler+0x51
0685feac 5a392264 00000000 00000000 00000000 w3core!W3_STATE_HANDLE_REQUEST::DoWork+0x9a
0685fed0 5a3965ea 00000000 00000000 00000000 w3core!W3_MAIN_CONTEXT::DoWork+0xa6....
The exception code here that Application Verifier is raising is 00000013 which means a Buffer Overrun.
The code that I used to test this is:
1: {
2: char *ptr, *tmp;
3: int i;
4:
5: ptr = (char*)GlobalAlloc(GMEM_FIXED, 16);
6: tmp = ptr;
7:
8:
9: for (i = 0; i < 32; ++i)
10: *(tmp++) = 'a';
11:
12: GlobalFree(ptr);
13:
14: }
Comments
- Anonymous
December 27, 2009
The comment has been removed - Anonymous
September 17, 2010
Just a friendly reminder to be sure to remove w3wp.exe from App Verifier's image name list when you're finished debugging and troubleshooting. Otherwise you could have some performance issues.
- open application verifier
- locate w3wp.exe in the image name list
- right click on w3wp.exe in the image name list and select "delete application"
- restart IIS (or recycle application pools)
- Anonymous
October 03, 2012
The DebugDiag link was broken - here is what I found (version 1.2) www.microsoft.com/.../details.aspx

