Windows Server Dashboards

These are some cool Dashboards brought to the community by Satya Vel a few years ago.
This was brought to my attention for Dashboard functionality from SCOM 2012R2 to provide visibility for Windows Computer Health state
After a history lesson, I had to find the source!
256 cores increased the limit in Windows Server 2008R2
Prior it was 64 cores (look how far we've come!)
The Processor perfmon object is potentially limited since. The Windows Team built the 'Processor Information' counter to handle above 64 cores (256 as of the below article)
Beyond the history lesson, let's get to the dashboards!
Why do you ask? The Windows Server MP's as far back as I have (MP version 7230) use 'Processor Information' instead of 'Processor'
Flash forward to the Momteam blog in 2012
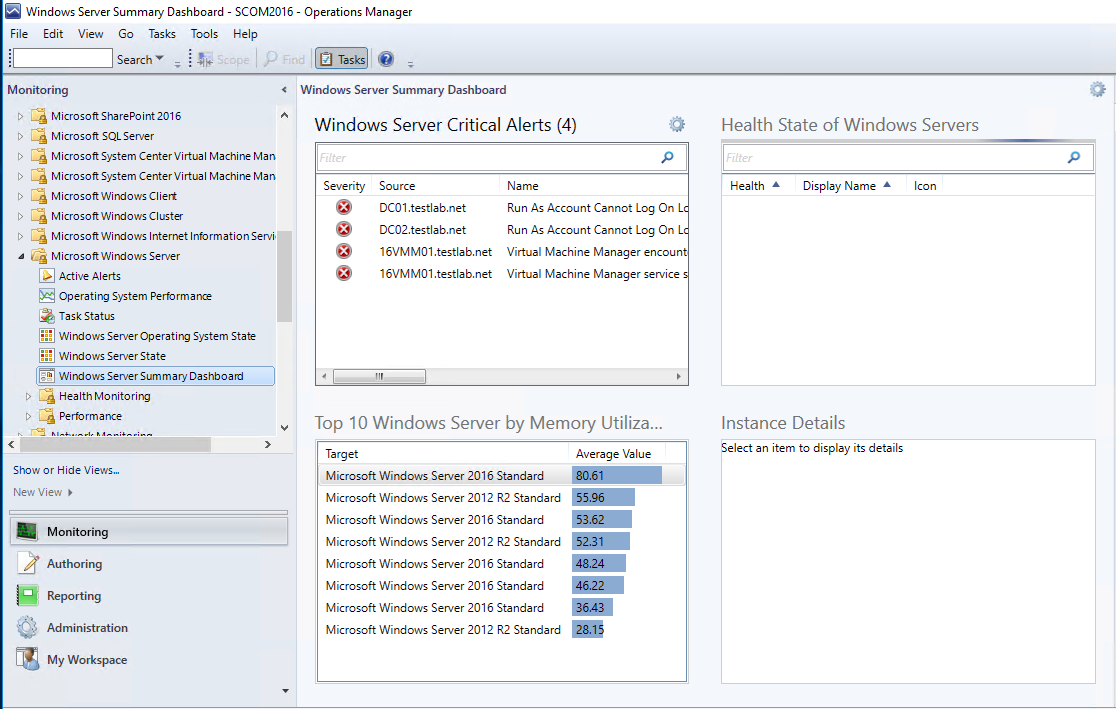
Windows Server Summary Dashboard

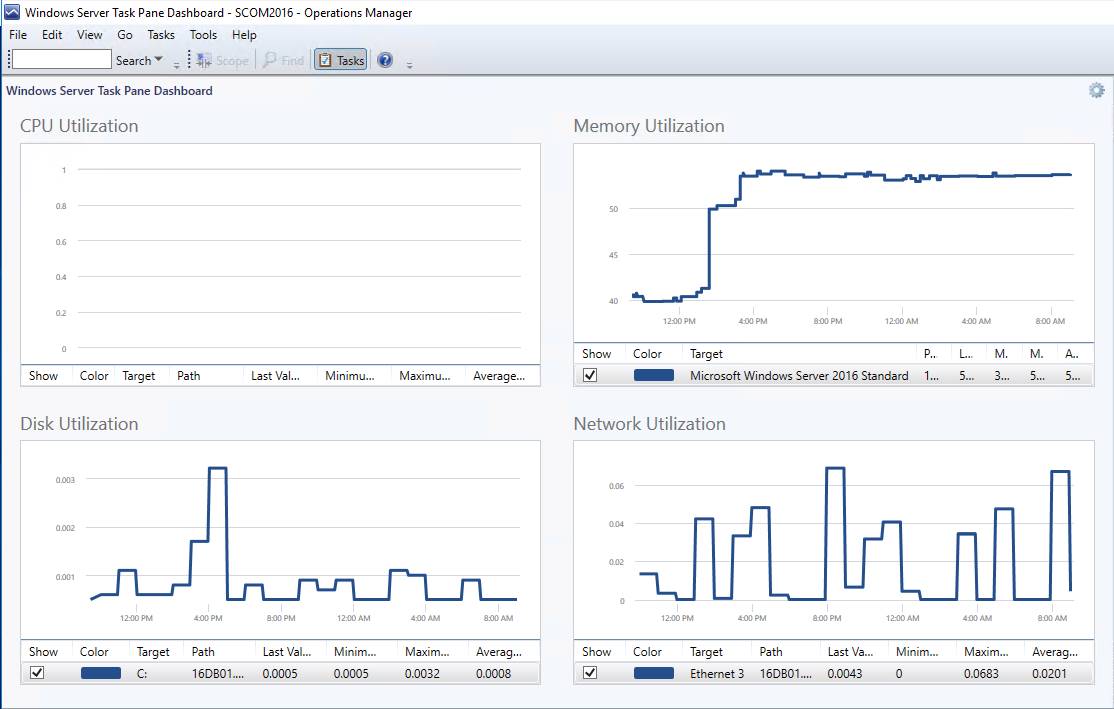
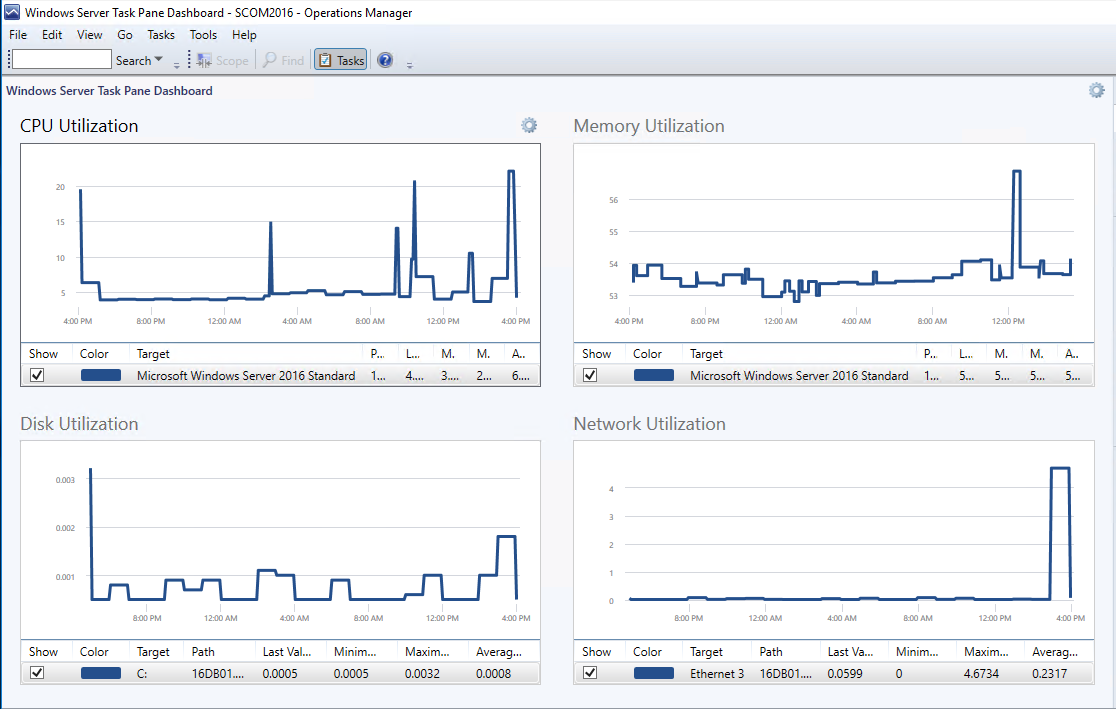
Task Pane Dashboard
From the Monitoring Tab
Click on the Windows Computer view
Highlight the computer you want to see performance information on
Click the 'Windows Server Task Pane Dashboard' in Tasks pane

What happened to CPU!

Using with SCOM 2012R2, 2016, and even TP1801 the Dashboard happened to work on my DC's. Processor is gathered from the AD Directory Services management packs.
With some help, the Task Pane Dashboard was corrected to target Processor Information versus Processor

If you use the console to troubleshoot issues, it's simple to do.
Save the packs from the Gallery, and import the two MP's
Go use the dashboards!
Gallery https://gallery.technet.microsoft.com/Updated-Windows-Server-ff45737d