An in depth look at the Historical Debugger in Visual Studio 2010 (Part VI)
In previous blogs, I have covered the Historical Debugger extensively and talked about many of the scenarios. In this post, I'll walk through another scenario where the Historical Debugger is very useful which is Load Testing. When loading testing an application, you can have the Historical Debugger collect information during the run and if one or more of the tests fail, you can use the Historical Debugger log file to debug the test failure(s).
Let's walk through an example. For this walkthrough, I have a Load Test which contains a single Web Test. The application under test is the BeerHouse sample application.
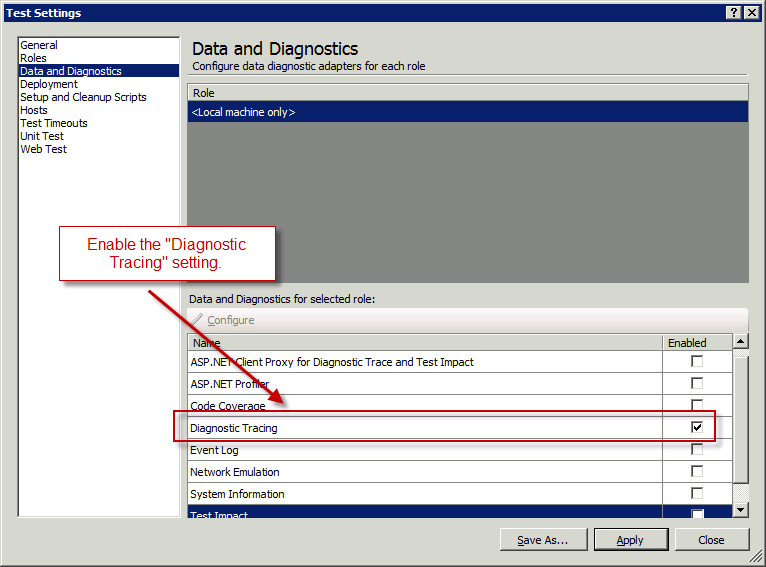
The first step in setting up the Historical Debugger for collecting data during load testing is to enable the "Diagnostic Tracing" option in the Test Settings, as shown below.

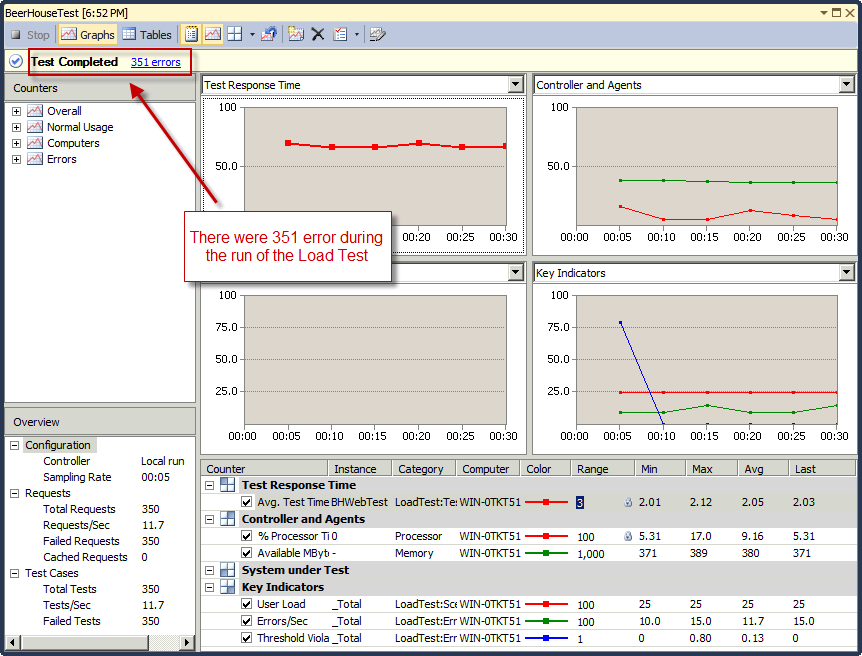
Once you've enabled the Historical Debugger, the next step is to run the Load Test. After the Load Test is complete, you should see the test result details which also includes the number of errors, shown below.

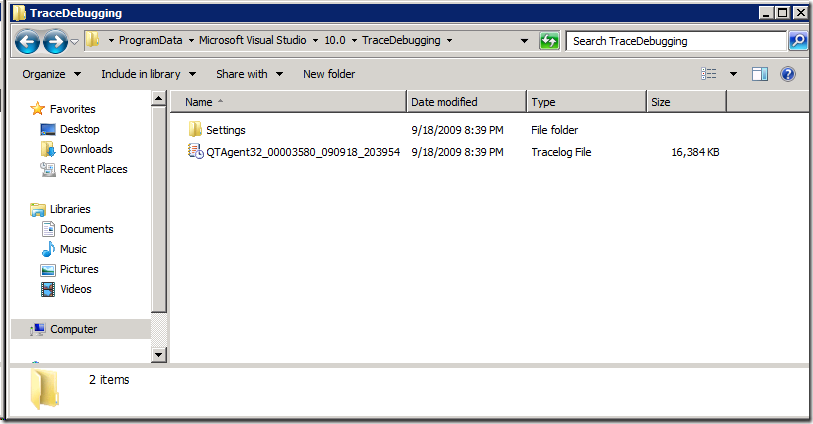
While the Load Test was executing, the Historical Debugger was recording the execution history. The following screenshot shows the Historical Debugger log file (QTAgent32_000013d0_090918_204309.tdlog).
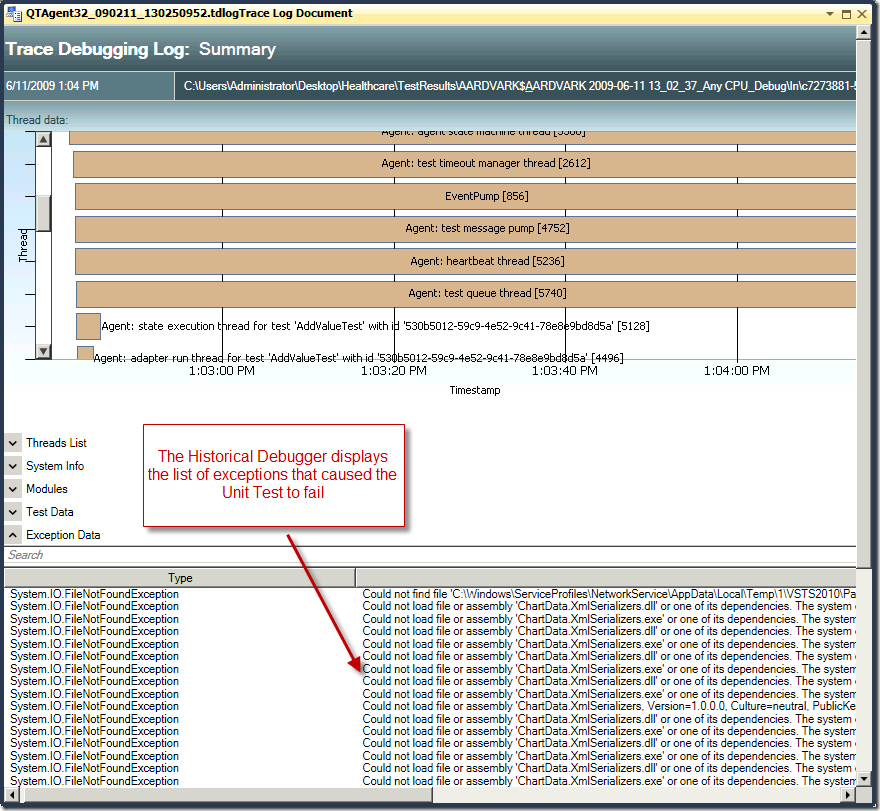
Double-clicking the log file opens the Historical Debugger Summary page, shown below. Using the summary page, you can investigate the root cause of the test failure.

Habib Heydarian.
