JavaScript Memory Leak Detector (v2)
IntroductionJavaScript Memory Leak Detector ( download ) is a debugging tool to detect memory leaks and enforce best practices in JavaScript code when working with version of Internet Explorer older than IE8.As described in detail in this MSDN article the JScript garbage collector in previous versions of Internet Explorer manages the lifetime of JScript objects but not of DOM objects. As a result, the JScript garbage collector cannot break circular references between DOM objects and JScript objects, and memory leaks may occur.
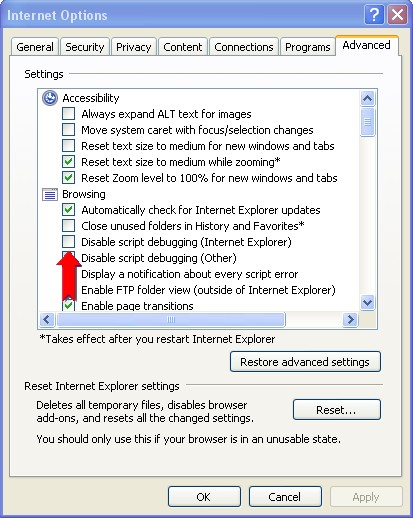
Programmers who need to support older versions of the Internet Explorer browser should still try to pay attention to programming patterns such as JScript closures, as they could cause memory leaks. The leak detector works hosting an IE WebBrowser control and intercepting the execution of JavaScript inside IE. It monitors al the DOM elements in the markup of a web document that somehow interact with JavaScript and presents a list of potentially leaked objects to the user, together with information about the scripts loaded in the page and, if possible, a hint to the instruction that may have caused the leak. Installation notesIEJSLeaksDetector is a plain, native, Windows application and does not require any particular setup (the executable can be just unzipped and run).It only runs in 32 bit versions of Windows. 64 bits editions are not supported yet. There are only two installation steps required to make sure that the tool works correctly: 1. The tool requires that the pdm.dll script installer is installed in the machine. This DLL is normally installed with any version of Microsoft Visual Studio.In case you are unable to install Visual Studio in the target machine, a simpler way to install pdm.dll is by installing the Microsoft Script Debugger, freely downloadable here.2. The tool also requires Internet Explorer script debugging to be enabled to work correctly. Verify that the check box "Disable script debugging (Other)" is unchecked, in IE ('Tools' menu -> Internet Options -> 'Advanced' tab -> 'Browsing' section) as shown in figure.
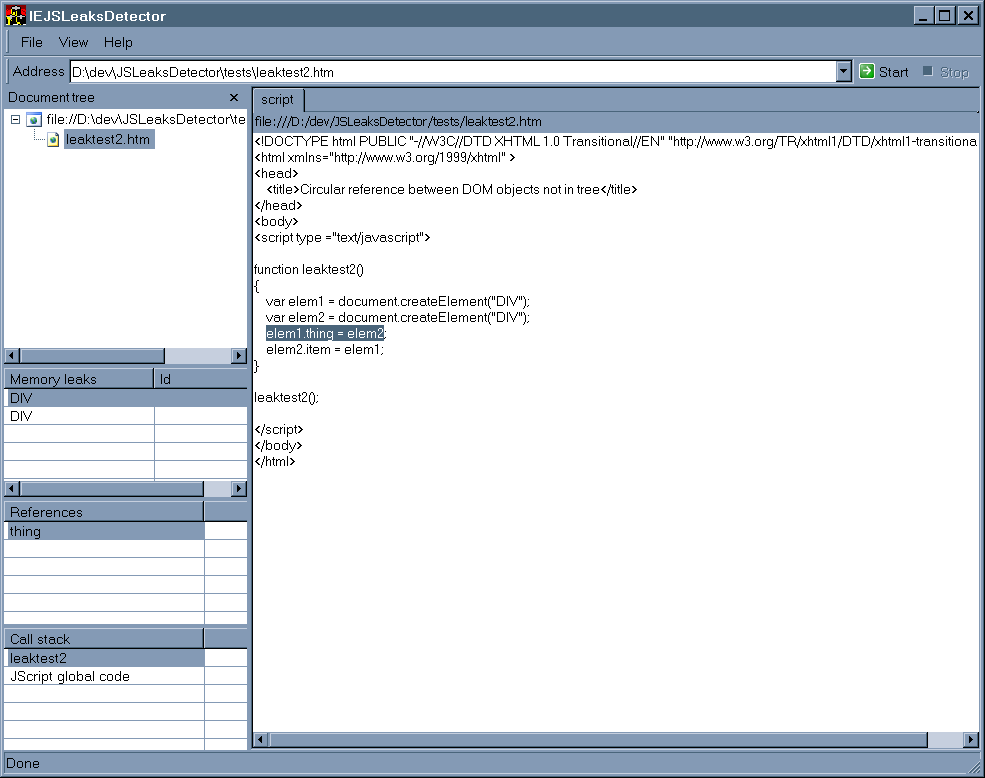
How to use the toolThe user can start the memory profiling of a web application navigating to the desired URL. A new tab is opened with a WebBrowser control and a tree view shows all the documents and scripts that compose the current page.When the user has finished to interact with the page he can click the "Stop" button, which causes the tool to close the control and track possible leaks. Memory leaks are listed specifying the DOM object's type and a list of "attached" JavaScript objects whose circular reference could be the cause of the leak. The tool also shows the call stack correponding to a memory leak, which represents the state of the script at the moment when the JavaScript object was attached to the DOM object. Finally, a script window highlights the exact point in the JavaScript code where the memory leak originated.More information can be found in the docs enclosed with the binaries. | |
|
|
Comments
- Anonymous
September 01, 2009
Thank you new version release! so,is JavaScript Memory Leak Detector (v2) supported protetype.js which isn't supported by previous version ? thanks.
