Parsing an extended message trace
Regular message traces are sufficient for most mail flow troubleshooting, but occasionally we need more data which requires obtaining an extended message trace. These traces (provided as a CSV file) contain a plethora of information, however parsing them can be a very overwhelming experience.
I would like to share the work flow that I use when I need to extract data from an extended message trace. Hopefully this will help make your own experience a more pleasant one.
Obtaining an extended message trace
Obtaining an extended message trace can be tricky if you’ve never requested one before. In the Message Trace tool, set a custom date range and ensure the starting date is at least a week in the past (this is the key to enable the extended trace). Add either a sender, recipient, or Message ID, and check off the box Include routing events and routing details.
These traces typically take at least an hour to complete. Once completed, you can download the CSV file at the link View pending or completed traces on the Message Trace page.
For more information on running a message trace see Run a Message Trace and View Results.
When opening the resulting CSV with Excel, you’ll see something like this.
Yikes right? Well, with a little Excel magic, we can make this file much more workable.
Parsing an extended message trace in Excel
After opening the CSV file in Excel you should see something like the previous screenshot. Excel should split the data up into columns automatically, but if not you’ll need to perform a manual import and select a comma as the delimiter.
Sort the data chronologically
Message traces do not come sorted by date and time (in fact they aren’t sorted by anything), and so this is the first order of business.
Highlight the first row, then click the Data tab, and then Filter.

To make reading our headers easier, highlight the entire first row again, and then click Format under the Home tab, and then Auto Fit Column Width.

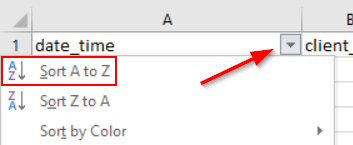
Expand the date_time column (first column) so you can see the full time stamp, then click the filter drop down for that column and select Sort A to Z.

Now that we have our trace sorted chronologically, we next need to start removing messages that aren’t part of our investigation.
Remove High Availability entries
High Availability entries can be ignored 99% of the time. These can be identified by entries under the event_id column which start with HA. To remove these rows, just filter them out through this column.
The exception here is HASUBMIT. If you see this listed, do not filter it out.
Only show rows pertaining to a particular message
Typically, we only want to see details from a particular message. The easiest way to do this is to filter based on the Message ID. If you don’t have the Message ID, you can also filter based on Sender, Recipient, Subject, etc. For this example, I’m going to filter based on Message ID.
Find the message_id column, click the filter drop down, and then uncheck select all. Now find your Message ID in the list, check it off, then hit OK.
I am now looking at 7 rows, compared to my starting point of over 7,000 rows! Each of the now remaining rows represent a different EOP server that this message traversed through.
Some rows are more interesting than others, and typically the most important row is where the EOP header (x-forefront-antispam-report) values are stamped on the message.
Extracting the EOP (x-forefront-antispam-report) header
One of the most important items we can pull from the extended message trace is the x-forefront-antispam-report header information for a message. This is especially helpful when we do not have the original .msg file for a message we are investigating.
This data can be found in the custom_data column. Look for the cell that starts with S:AMA= .
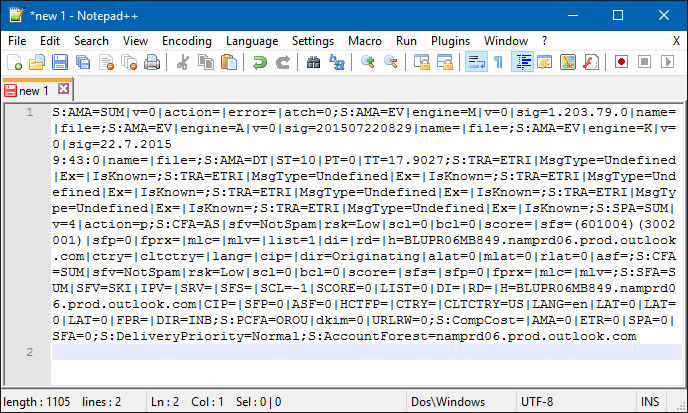
For my workflow, I copy the contents of this cell and paste it into Notepad ++ which results in this view.
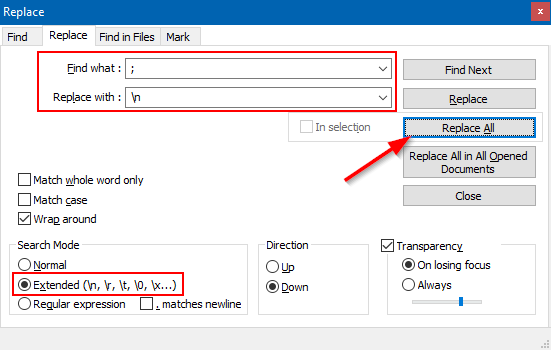
To clean this up, I use the Replace action. Use the following options in the Replace window, and then click Replace All.
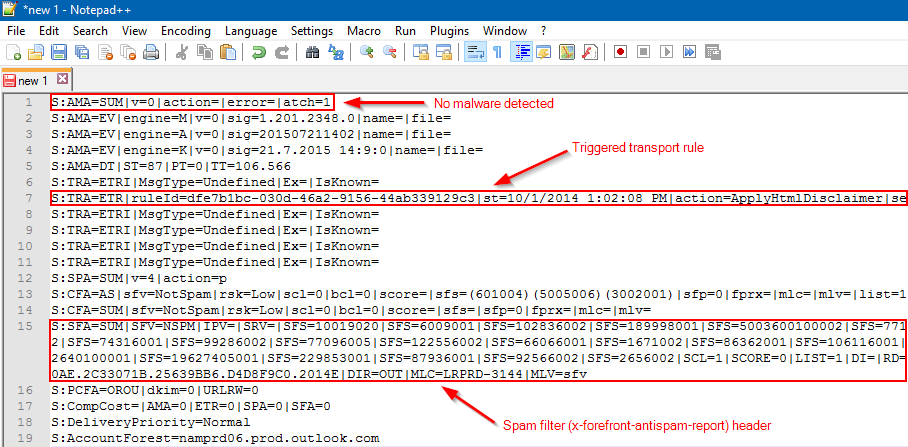
I can now very easily pick out the various EOP results.
Some interesting items we can quickly pull from here as follows:
- S:AMA - Anti Malware Agent: Will indicate if any viruses were detected.
- S:TRA=ETR – Transport Rule Agent: ETR|ruleid=[guid] will indicates the GUID of any transport rules that triggered (Note: S:TRA=ETRI and S:TRA=ETRP do not indicate rules that have been triggered)
- S:SFA = Spam Filter Agent: Will display contents from the X-Forefront-Antispam-Report header (Spam Filter Score, Spam Filter Verdict, message direction, etc…)
Here is the S:SFA string from an extended trace with the SCL, SFV, and direction values highlighted.
S:SFA=SUM|SFV=SKN|IPV=|SRV=|SFS=|SCL=-1| SCORE=0|LIST=0|DI=|RD=|H=BLUPR06MB849.namprd06.prod.outlook.com|CIP=|SFP=0|ASF=0|HCTFP=|CTRY=|CLTCTRY=US|LANG=en|LAT=0|LAT=0|LAT=0|FPR=|DIR=INB
This was an inbound message which EOP gave an SCL of -1 to. The Spam Filter Verdict for this message is SKN which indicates the safe listing was done prior to the spam filter (ex. Transport rule).
For more information on the custom_data column, see Run a Message Trace and View Results. On this page, expand information under the “View message trace results for messages that are greater than 7 days old.”
EOP Outbound Connector that was used
For mail that is leaving your Office 365 tenant, the extended trace can tell us which EOP outbound connector was used to deliver the message. For an outbound message, look in the cutom_data column for a row that begins with S:E2ELatency= . In this example, my outbound message was sent using an EOP outbound connector that I created called xbox.com outbound.
S:E2ELatency=32.140;
S:ExternalSendLatency=3.155;
'S:Microsoft.Exchange.Hygiene.TenantOutboundConnectorCustomData= Name=xbox.com outbound;
ConnectorType=Partner;
UseMxRecord=False';
S:OutboundProxyTargetIPAddress=xx.xx.xx.xx;
S:OutboundProxyTargetHostName=xx.xx.xx.xx;...
I can also see that this connector is type Partner, and uses a smart host for delivery because UseMXRecord is set to false. The OutboundProxyTargetIPAddress property shows us the recipient IP (I have obfuscated the actual IP in the text above).
Server SMTP responses
Another interesting piece of data we can pull from extended traces are the SMTP server responses. Earlier this year, this information was made available in standard message traces so you no longer need to run an extended trace to obtain it.
If you do have an extended trace, server responses can be seen under the recipient_status column. Here’s an example of Office 365 being unable to deliver a message. The recipient server responded to the delivery attempt with a 450 error stating a certificate problem.
'450 4.7.0 Proxy session setup failed on Frontend with ''451 4.4.0 Primary target IP address responded with: "454 4.7.5 Certificate validation failure." Attempted failover to alternate host, but that did not succeed. Either there are no alternate hosts, or delivery failed to all alternate hosts. The last endpoint attempted was xx.xx.xx.xx:25'''
Delivery folder
For inbound messages destined to mailboxes hosted in Exchange Online, an extended message trace will show us which folder in the recipient’s mailbox the message was delivered to.
Note: This only works if the recipient mailbox is located in Exchange Online, and only works for server side mailbox rules that cause a message to be delivered to a particular folder.
For example, here’s an inbox rule that I have configured on my Exchange Online mailbox.
When I run an extended message trace on a message that would have triggered this mailbox rule, I can see the folder where this message was delivered.
Just look for the DELIVER event in the event_id column, and look at the recipient_status column. A semi-colon in the recipient_status column indicates that the message was delivered to the recipient’s inbox.
Summary
I’ve only just scratched the surface of what data can be extracted from extended message traces. While these traces can initially be overwhelming, the above tips, combined with experience will make extracting data from them much easier.
Resources
Run a Message Trace and View Results
Message Trace FAQ
Comments
- Anonymous
December 02, 2015
excellent as always
Thanks - Anonymous
December 02, 2015
Amazing article, Andrew. This is perfect, as I often have trouble getting header information out of our users. - Anonymous
December 03, 2015
Andrew, thanks for another insightful and timely article. As more and more EOP and Advanced Threat Protection touches the mail, being able to decode and understand the trace is critical.
A Question. Is Microsoft considering to allow extended trace for 24 hours or 7 days. It is painful sometimes to have to collect more data than needed just to get Extended Trace within the GUI. - David - Anonymous
December 04, 2015
Hi David, great question. I haven't heard anything on this. Currently the best course of action is to make the original search criteria as strict as possible. I'll be sure to suggest this though. - Anonymous
December 09, 2015
Great article! Where to get more details, since surface is scratched? :)I think i went through almost all on technet. - Anonymous
October 21, 2016
The comment has been removed- Anonymous
October 27, 2016
You are correct in your analysis. This rule was evaluated, but did not trigger.
- Anonymous


