Introducing the Microsoft Open Data Protocol Visualizer (CTP1)
1. IntroductionThe Open Data Protocol Visualizer for Visual Studio CTP1 (“the visualizer”) is a extension that provides a read-only visualization of the types, properties, associations, and other objects in the Entity Data Model (EDM) returned from an Open Data Protocol’s metadata endpoint (this document assumes basic familiarity with the EDM).
For instructions on how to create a data service, see here.
This blog post uses a slightly modified version of a model reverse-engineered from part of the Northwind database. For general purposes, the AdventureWorks sample database, or any other database you choose, will work as well.
2. Walkthrough
The modifications made to the Northwind model were done in order to demonstrate additional features of the visualizer. Specifically:
1. The address fields in various types in the model have been replaced by the usage of a Complex Type called “Address”.
2. A subtype of Product called “DiscontinuedProduct” has been added.
a. The “Discontinued” property has been removed from Product.
b. Product is mapped to the Products table with condition Discontinued=false
c. DiscontinuedProduct is mapped to the Products table with condition Discontinued=true
3. Two function imports have been added to the model for the “Employee_Sales_by_Country” and “Sales_by_Year” stored procedures.
4. For each stored procedure, a complex type has been created to hold its results, and a method added to the data context to enable it.
The XML for this model is available for download here.
2.1 Install
Launch the “Extension Manager” from the Visual Studio “Tools” menu. The visualizer is available from the online gallery, and you can find it quickly by entering “Open Data Protocol” into the search field:
The visualizer is available for download from the Visual Studio Gallery here:
https://visualstudiogallery.msdn.microsoft.com/en-us/f4ac856a-796e-4d78-9a3d-0120d8137722
2.2 Setup
To get up and running:
1. Create a solution containing a web application project and a console application.
2. Add a new, blank ADO.NET Entity Data Model to the web application.
3. Close the model.
4. Right-click the model file, select “Open With” and in the list, select “XML Editor”.
5. Paste the contents of the Modified Northwind Model into it.
6. Save and close the model file.
7. If you do not have it already set up, add the Northwind.MDF database to the web application’s App_Data folder.
8. Double-click the model file to open it with the designer.
9. Right click on the designer surface and select “Update Model from Database”.
10. Select the connection to Northwind.MDF, which will be automatically created for you when the MDF file is added to App_Data. If you are using your own database, you may need to create a new connection to it.
11. Proceed through the update wizard, accepting all the defaults, adding no new objects. This process will set up the database connection for you in web.config. It should look like this:
<add name="NORTHWNDEntities" connectionString="metadata=res://*/Model1.csdl|res://*/Model1.ssdl|res://*/Model1.msl;provider=System.Data.SqlClient;provider connection string="Data Source=.\SQLEXPRESS;AttachDbFilename=|DataDirectory|\NORTHWND.MDF;Integrated Security=True;User Instance=True;MultipleActiveResultSets=True"" providerName="System.Data.EntityClient" />
12. Add a new WCF Data Service (in Beta2 this will show up as ADO.NET Data Service) and configure it as shown below. Note the additional web methods and the exposure of all entity sets and all service operations using the “*” string. This lack of security means that this is not a data service that you would want to expose publicly.
using System;
using System.Collections.Generic;
using System.Data.Objects;
using System.Data.Services;
using System.Data.Services.Common;
using System.Linq;
using System.ServiceModel.Web;
using System.Web;
namespace NorthwindServices
{
public class NorthwindService : DataService<NORTHWNDEntities>
{
// This method is called only once to initialize service-wide policies.
public static void InitializeService(DataServiceConfiguration config)
{
config.SetEntitySetAccessRule("*", EntitySetRights.AllRead);
config.SetServiceOperationAccessRule("*", ServiceOperationRights.All);
config.DataServiceBehavior.MaxProtocolVersion = DataServiceProtocolVersion.V2;
}
[WebGet]
public ObjectResult<Employee_Sales_by_Country_Result> GetEmployeeSalesByCountry(DateTime start, DateTime end)
{
NORTHWNDEntities entities = new NORTHWNDEntities();
return entities.Employee_Sales_by_Country(start, end);
}
[WebGet]
public ObjectResult<Sales_by_Year_Result> GetSalesByYear(DateTime start, DateTime end)
{
NORTHWNDEntities entities = new NORTHWNDEntities();
return entities.Sales_by_Year(start, end);
}
}
}
13. Right click on the service and select “View in Browser”.
14. Copy the URL shown in the browser, it should look like this: https://localhost:11968/NorthwindService.svc
15. In the console application project add a new service reference.
16. Paste the URL into the “Address” field. Change the “Namespace” to “NorthwindServiceReference”, as shown below.
17. Click OK.
2.3 Visualizing the Model
The visualizer consists of two main components: The diagram, which can show all, or part of the model, as a two-dimensional graph, and the model browser, which is a Visual Studio tool window that presents the complete contents of the model as a hierarchical tree. We begin by examining the structure and capabilities of the diagram.
2.4 Launching the Visualizer
Once installed, the visualizer is launched by right-clicking any Service Reference that supports the Open Data Protocol and selecting “View in Diagram”:
This will bring up the overview screen in a new document window. This screen provides a number of quick links for rapidly creating a diagram:
Link |
Behavior |
Data services model browser |
Will make the model browser tool window visible. |
Add all namespaces |
Adds all entity types and complex types, and by extension, all associations, to the model. |
Add all entity types |
Will add all entity types, and any associations between them, to the diagram. |
Add all hubs |
Will add the entity types whose number of associations is in the top 25% in the model to the diagram. This is intended to provide a useful starting point in making sense of models by adding only the most highly connected types. |
Add all complex types |
Will add all complex types to the diagram. |
Add all associations |
Adds all associations and their entity types to the diagram. |
2.5 Working with a Diagram
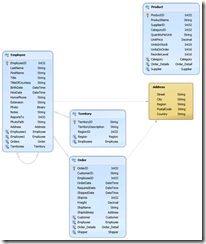
1. Selecting “add all hubs” will result in the following diagram:
2. Deselect any selected objects (by clicking anywhere on the canvas) and right-click the “Employee” shape to bring up this context menu:
Select “Add Related Entities”.
3. Click on Employees again and select “Add Related Complex Types”.
4. Switch to the left-to-right view (Alt+Right Arrow.)
The diagram now shows all entity types related to Employee as well any complex types used by it:
5. Multi-select Order and Product and select “Add Related Entities”. At this point, most of the model will be visible in the diagram. Note that all newly added objects are now selected. This is intended to accomplish two goals: Allow easy iterative addition of related types to a model, and also make it easy to distinguish newly added types from previously added types.
2.5.1 Visualizing Relationships
1. We can further simplify the rendering of the model by changing the way shapes are rendered. Right click anywhere in the diagram and unmark the “Expanded Shapes” checkbox command. This will hide all properties, making it easier to focus on relationships between types:
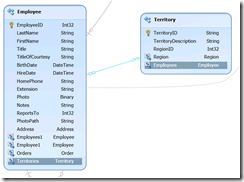
2. Selecting an association will highlight the navigation properties that navigate it. For example, after expanding the shapes to show properties again, we select the association between Employee and Territory and see that navigation properties Employee.Territories and Territory. Employees, which traverse this association, become highlighted:
3 Using the Model Browser
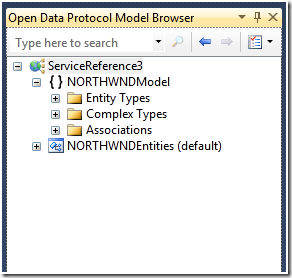
The Model Browser provides an unfiltered view of the model. Its root contains a schema node for each namespace in a model, and a node the EntityContainer.
To show the model browser, go to the “View” menu item in Visual Studio and select “Data Services Model Browser”. You can also right-click in the visualizer and select “Show In Model Browser”, which will bring the model browser into view and select the object under the mouse.
3.1 Schema Nodes
Schema nodes show the entity types, complex types, and associations in a schema.
To add a type to the diagram, expand the Entity Types node and drag and drop it onto the diagram. You can also right-click the type and click on “Select in Diagram,” or double-click it. This will add the type to the diagram if it is not present, select it, and scroll the diagram to make the type shape visible.
These same actions also work for complex types and associations. In the latter case, adding an association to the diagram will add both of the association’s ends’ entity types as well.
1. Clear the diagram by selecting all objects using Ctrl+A and removing them using the Delete key.
2. Double-click the “Employee” entity type.
3. Drag and drop “Order” onto the diagram. Note that the location of the drop does not matter, as the layout in the diagram is always automatic.
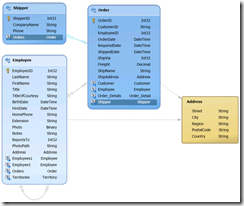
4. Right-click the “Address” complex type and click on “Select In Diagram”. Finally, double-click on the “FK_Orders_Shippers” association. With a left to right layout, your diagram should look like this:
Note that the addition of the foreign key added the “Shipper” type and selected both it and “Order”, which make up both sides of the association, and also selected the two navigation properties, “Order.Shipper” and “Shipper.Orders”, which traverse this association.
3.1.1 Properties
While the diagram surface does not yet allow selection of properties, the model browser does. Expand the Entity Types node, and within it, expand the “Category” type. Right-click “CategoryID” and select “View Generated Code” to see the code generated for this property. Close the code, right-click “CategoryID” and select “Properties” to view the property sheet for it.
3.2 EntityContainer Nodes
Expand the Entity Sets node and right-click on “Categories”. Selecting “View Generated Code” will take you to the dataServiceQuery<Category> that was generated from this entity set. Next, select “Go to Entity Type”, which should select the “Category” type. Finally, select “View in Browser” which will bring up the browser and point it at https://[your server]/NorthwindDataService.svc/Categories. Note that selecting “View In Browser” on entity types, for example on “Category”, will bring up the same URL, as all such queries must reference a type’s entity set.
3.3 The Search Bar
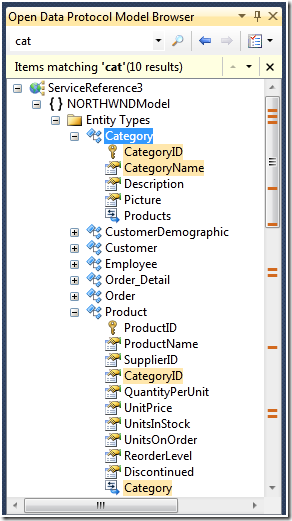
At the top of the model browser is the search bar. Collapse down the model browser to its root node and click the search box labeled “Type here to search”. In the search box, type “cat” and hit enter or click on the icon. The search will cover all objects in the entity container and schema nodes, down to individual properties or association ends. The model browser will show the search results bar, expand all nodes with matches and highlight those matches, and provide tick marks on the scroll bar:
Click the up/down arrows to the right of the “Items matching…” message to move forward and back through results. You can also click on tick marks, which will scroll the corresponding match into view and select it. When you are done, click the button at the right of the search results bar to clear out the search. You can perform this search again any time by selecting the search from the search box’s drop-down search history:
4. Conclusion
This walkthrough does not touch on some additional capabilities of the visualization tool, such as the ability to display data services-specific metadata. We will cover these capabilities, and others, when we release the next update to this tool.
We hope you will find this tool useful and look forward to your feedback.
Noam Ben-Ami & Fabian Winternitz
Microsoft
Comments
Anonymous
November 17, 2009
I've beein using ADO.NET Data Services for quite some time now and I was always wondering when somthing like this would be available for us. That dream has now been realized! Thanks for making our lives easier.Anonymous
November 17, 2009
I second that! I tried this at work and it was neat to finally see something like this.I couldn't managed to install it at home though. I'm using Visual Studio 2010 C# Express Beta 2. Is there any special step any need to follow?Anonymous
November 18, 2009
Awesome tool! Will this be part of the final release as well?Anonymous
November 18, 2009
Hmm, I installed this on VS2010 Ultimate Beta2, but I don't get the option to view in diagram on my ADO.NET Data service reference in my test console application. Looking at the Extension Manager though, the extension seems to be present. Any idea on how I can give it a kick?Anonymous
November 19, 2009
A must have for Visual Studio!Anonymous
November 20, 2009
Visual Studio just isn't Visual Studio without Open Data Visualizer!Anonymous
November 20, 2009
ANSWERS TO QUESTIONS ABOVE:You cannot install any tool extension on Express SKUs. This tool per se will not be part of Visual Studio 2010 but we are looking into rolling the functionality into a future release. Greg, can you give us more information about how you got the package to install and the OS configuration that you are running on?Anonymous
November 22, 2009
What is the right place to discuss feature requests on this? I'm very excited on what it delivers already.I first saw this tool in Pablo Castro's presentation at Sharepoint Conference and it rocks!Anonymous
November 23, 2009
Vladimir - yes, this is a fine place to make feature requests.Anonymous
November 23, 2009
You can submit a suggestion for Vs2010 family of products here: https://connect.microsoft.com/VisualStudio . Be sure to clarify the product the suggestion is for so that it gets routed to our team.Anonymous
November 25, 2009
Pretty neat! I love the user experience on this tool. I wish all VS tools would have a similar experience (e.g. Database Designer)Anonymous
November 25, 2009
I think one of the coolest things is the integration between ADO.NET Data Services and SharePoint 2010. All my document libraries are exposed as Atom pub media links.Now, the interesting thing here is that I'm able to explore the entire SharePoint schema in a very straightforward way!Two thumbs up.Anonymous
November 27, 2009
I loved the the tool! Here are a couple things I noticed while using it:1) When the service is updated, I lost my current set of entities. It went back to the inital page where I can see the statistics. It's not a big deal for me but it would be nice to keep the current set of tyes if possible.2) I couldn't select on the entity properties. I workaround this issue by selecting the properties from the 'Open Data Protocol Model Browser' so I wasn't blocked.3) I couldn't fine a way to print the diagram. Is this expected?Thank you for the tool. It really helped us a lot!Anonymous
November 28, 2009
Jennifer,Here's my take regarding your questions:1) I see the same thing. Were you expecting to see something like in the Class Designer where the removed shapes are marked as red?I wouldn't expect new entities to be added to the canvas though.2) I don't think it works like that. I didn't have the neither yet although it would be a good addition.3) I think you need to export the diagram as XPS and then print it with some other tool. It doesn't seem to have print support.Anonymous
November 29, 2009
Jennifer and Vladimir,Thank you for the feedback. Comments:We would like to add the ability to refresh the data service directly from the tool and preserve your diagram. Thank you for helping motivate this.Making properties selectable directly in the diagram is a longer term goal. There are some technical issues that make this difficult, though, so it is something that may need to wait for a while. Yes, Vladimir is correct: XPS export is how we support printing for now. Thank you!Anonymous
November 30, 2009
Any chance we can get this in C# Express? I can use the ADO.NET Data Services but not the tool :(Anonymous
November 30, 2009
Sorry Michael - extensions are not supported in C# express.Anonymous
December 03, 2009
The comment has been removedAnonymous
December 03, 2009
The comment has been removedAnonymous
December 06, 2009
I've been using this a for a while now and it definitely helped us better understand what SharePoint schema is about. Thanks!It would be nice if the mouse navigation can be improved somehow.Thank you,.AAnonymous
December 09, 2009
Aadarshini, I think you can use CTRL+MouseWheel to zoom in or zoom out to avoid having to use the zoom control. It worked great for me!Thank you.Anonymous
December 10, 2009
The comment has been removedAnonymous
November 20, 2013
Is there a Open Data Visualizer extension for Visual Studio 2012?


