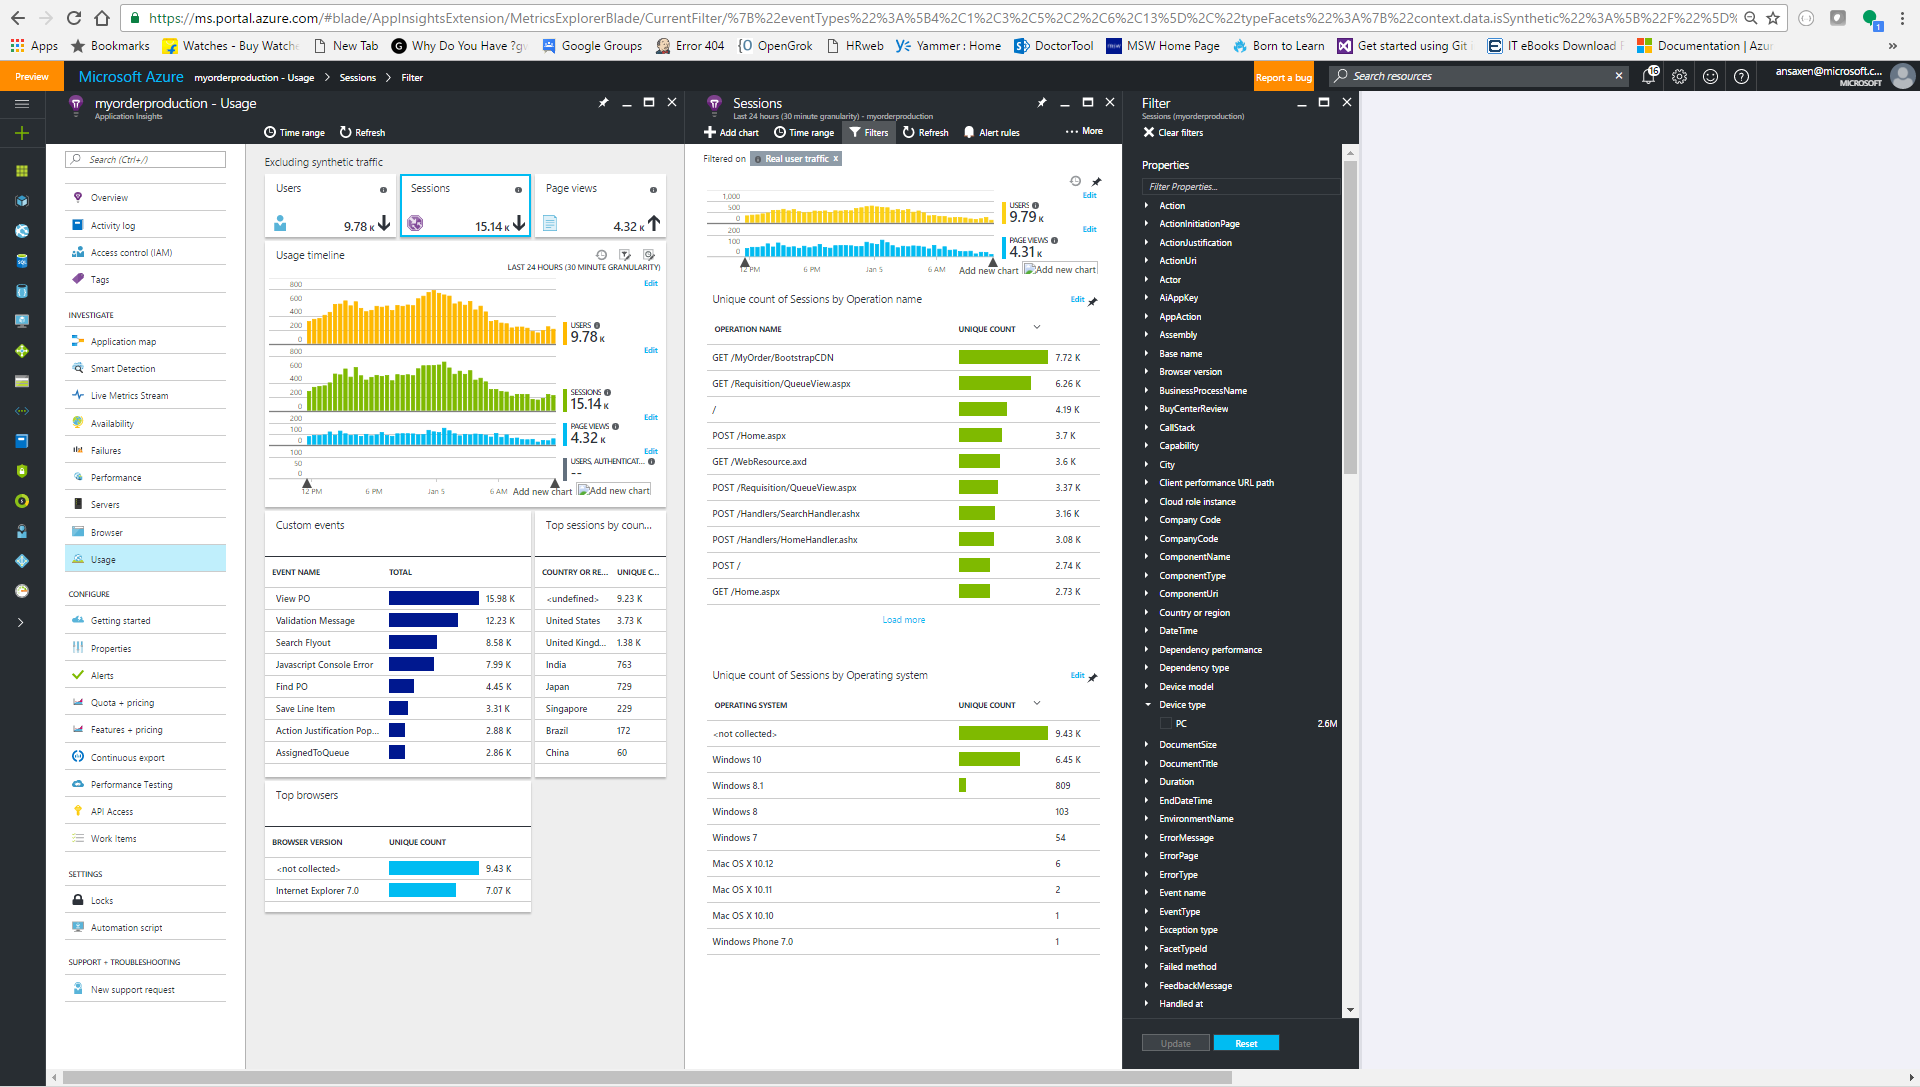
MyOrder Insights from Application Insights
-In the last 30 days, in MyOrder
-what have users searched for?
-how many search results have been shown in response to individual search keywords?
-what search factes have been used for individual search keywords
-what are the search terms that have not yielded any results
Kusto Query: let total = toscalar(event
| where app_Name contains "MyOrder"
| where timestamp >= ago(30d)
| where event_Name contains "Search Results Page"
| count);
event
| where app_Name contains "MyOrder"
| where timestamp >= ago(30d)
| where event_Name contains "Search Results Page"
| project Keyword=tostring(customDimensions.SearchKeyword), Facet=tostring(customDimensions.FacetTypeId), NumResults=toint(customDimensions.NoOfResults)
| summarize Count=count() by Keyword, Facet, NumResults
| extend Percentage = 100 * todouble(Count) / total
| sort by Percentage desc, Keyword asc
-In the last 30 days, in MyOrder
-what is the percentage distribution of the search facet?
Kusto Query:
event
| where app_Name contains "MyOrder"
| where timestamp >= ago(30d)
| where event_Name contains "Search Results Page"
| project FacetName = event_Name
| summarize Count = count() by FacetName
| extend Percentage = 100 * todouble(Count) / toscalar(event | where app_Name contains "MyOrder" | where timestamp >= ago(30d) | where event_Name contains "Search Results Page" | count)
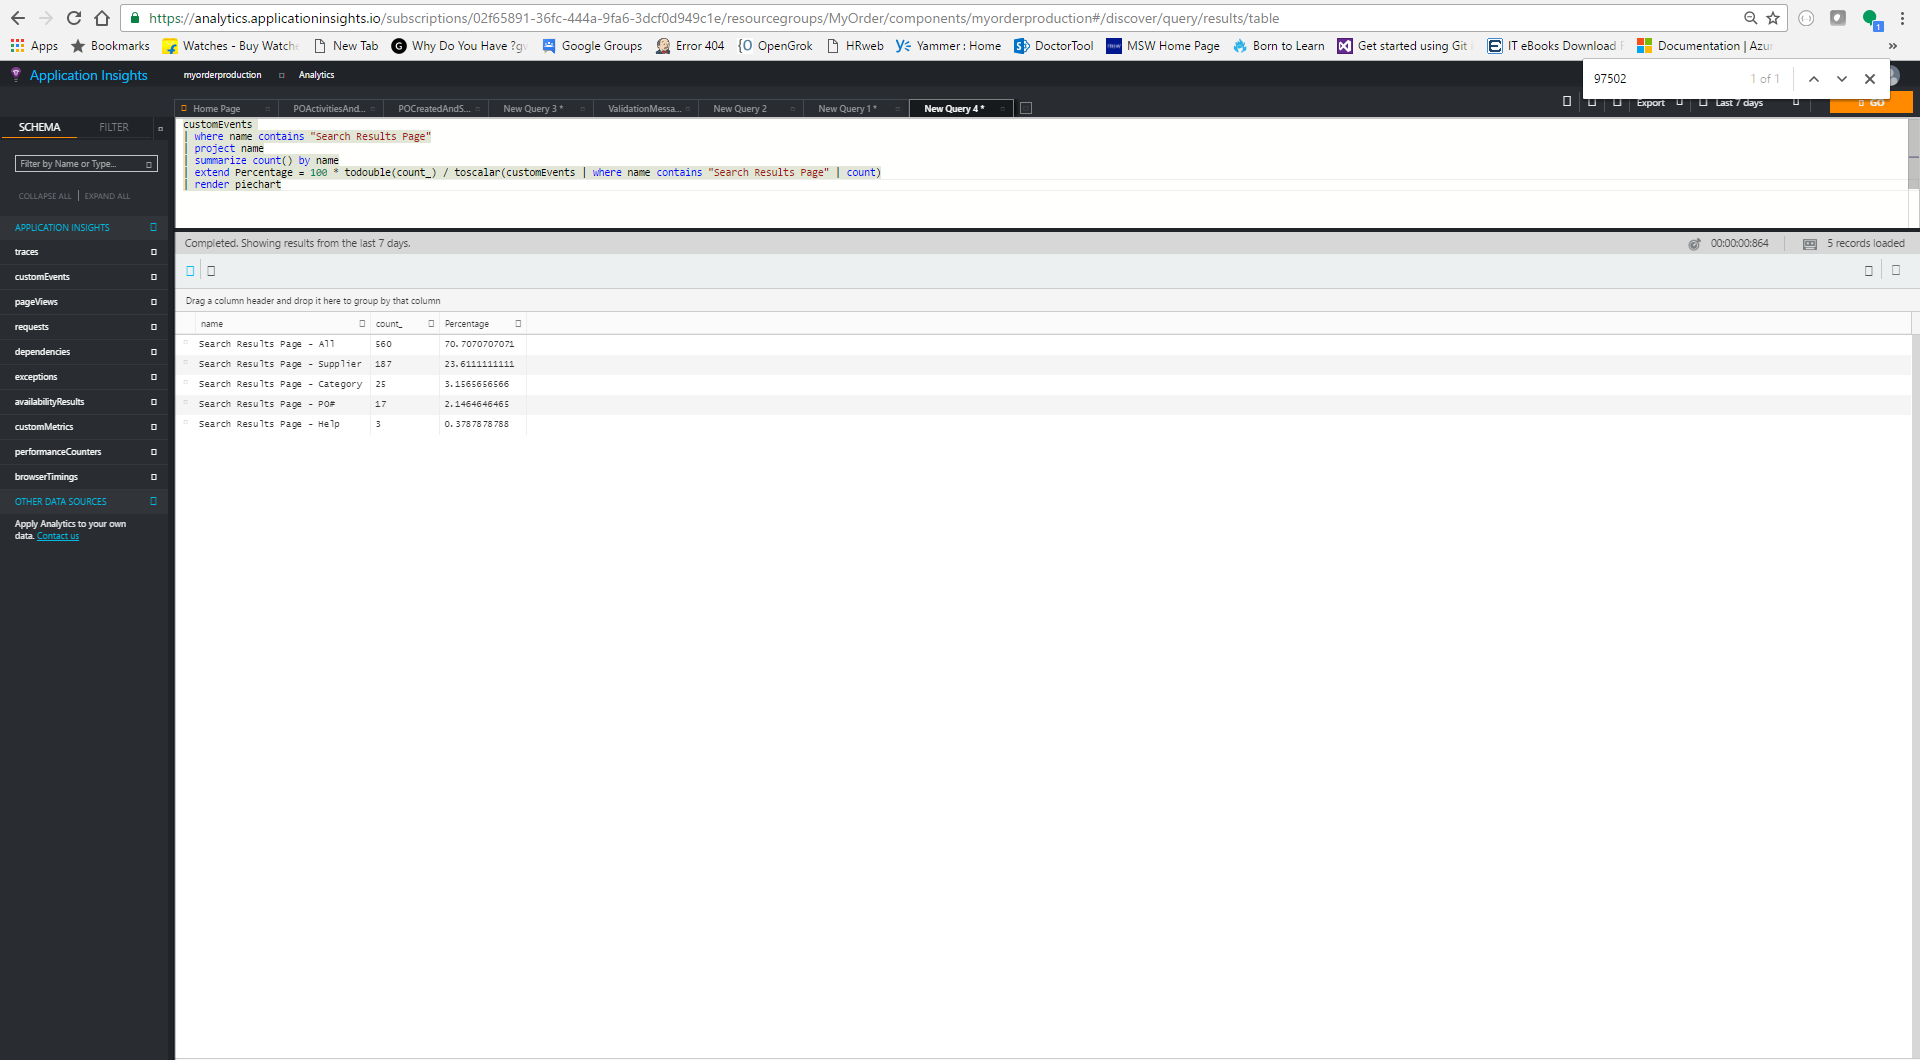
In the last 7 days, what search facet MyOrder users used during search while using the application?
Query: customEvents
| where name contains "Search Results Page"
| project name
| summarize count() by name
| extend Percentage = 100 * todouble(count_) / toscalar(customEvents | where name contains "Search Results Page" | count)
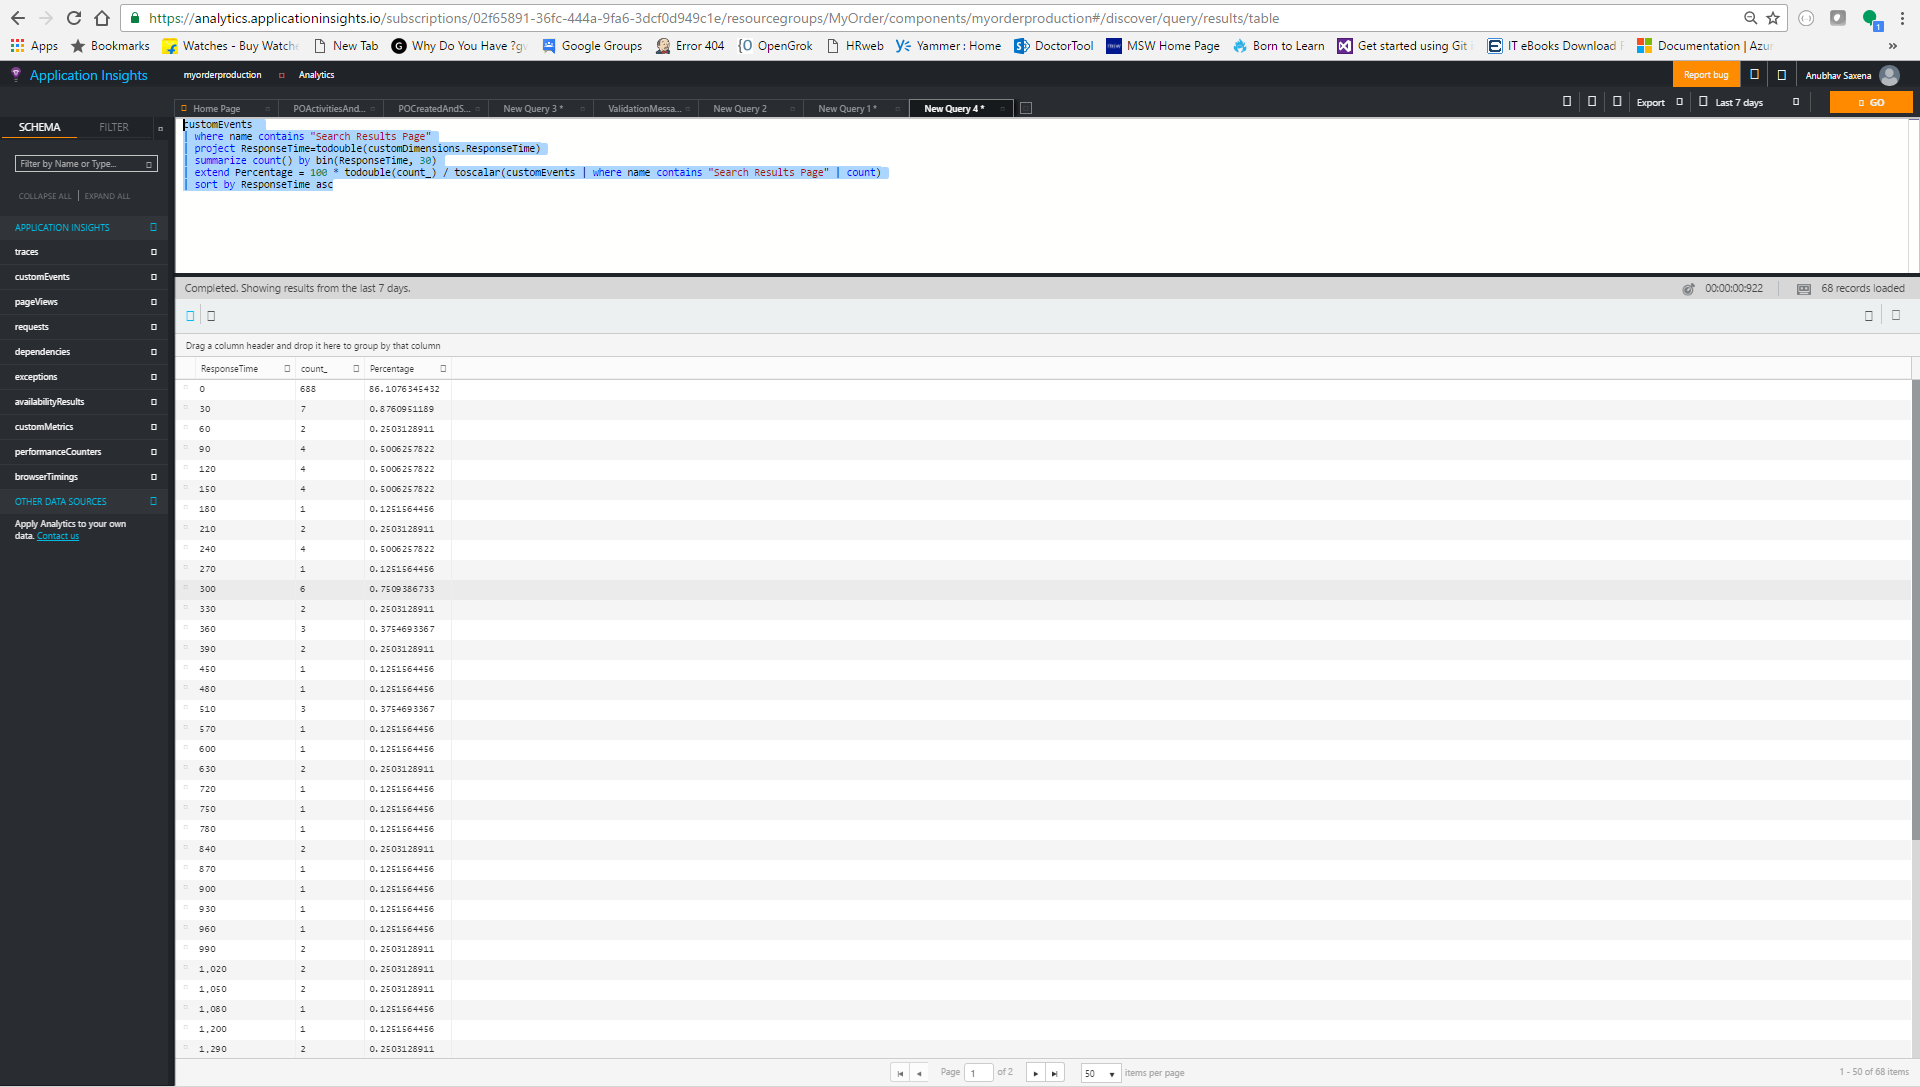
In the last 7 days, how much time the search took while using the application?
Query: customEvents
| where name contains "Search Results Page"
| project ResponseTime=todouble(customDimensions.ResponseTime)
| summarize count() by bin(ResponseTime, 30)
| extend Percentage = 100 * todouble(count_) / toscalar(customEvents | where name contains "Search Results Page" | count)
| sort by ResponseTime asc
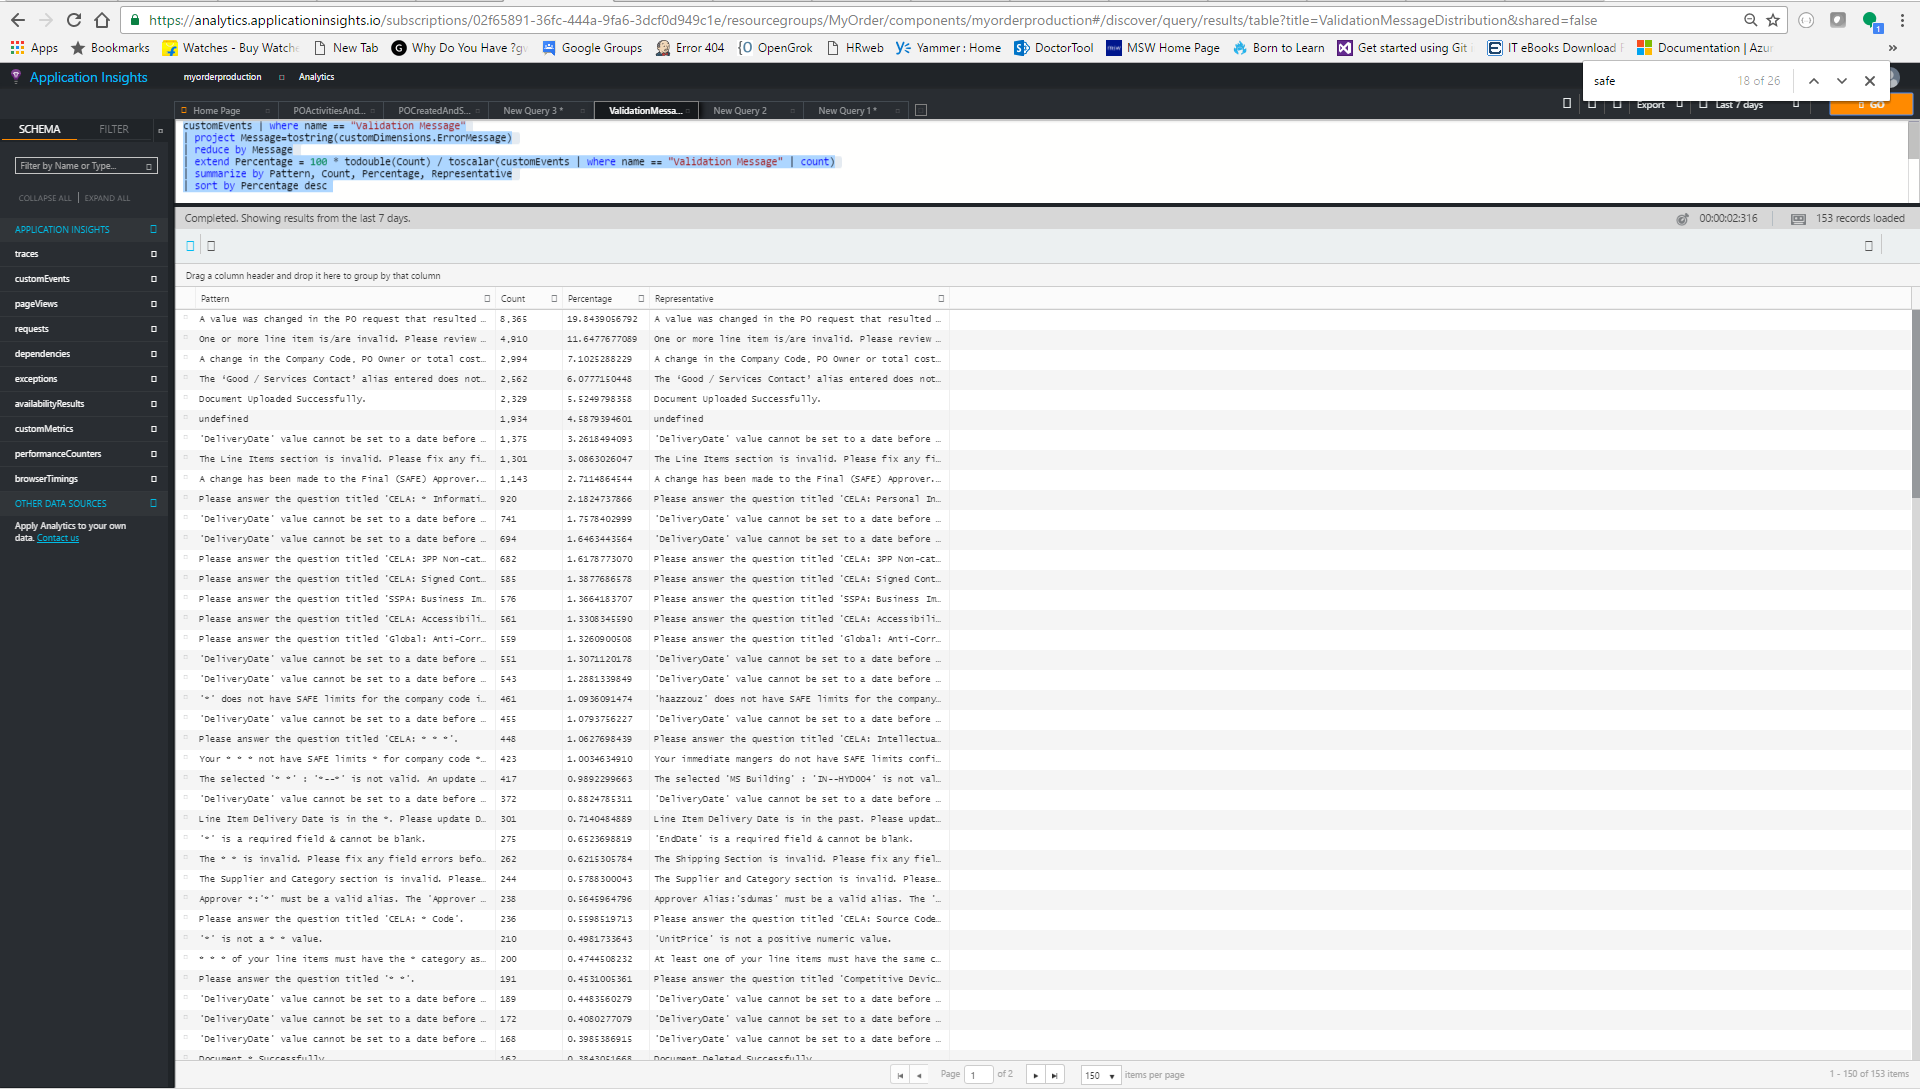
In the last 7 days, what are the top validation messages shown to the users while using the application?
Query: customEvents | where name == "Validation Message"
| project Message=tostring(customDimensions.ErrorMessage)
| reduce by Message
| extend Percentage = 100 * todouble(Count) / toscalar(customEvents | where name == "Validation Message" | count)
| summarize by Pattern, Count, Percentage, Representative
| sort by Percentage desc
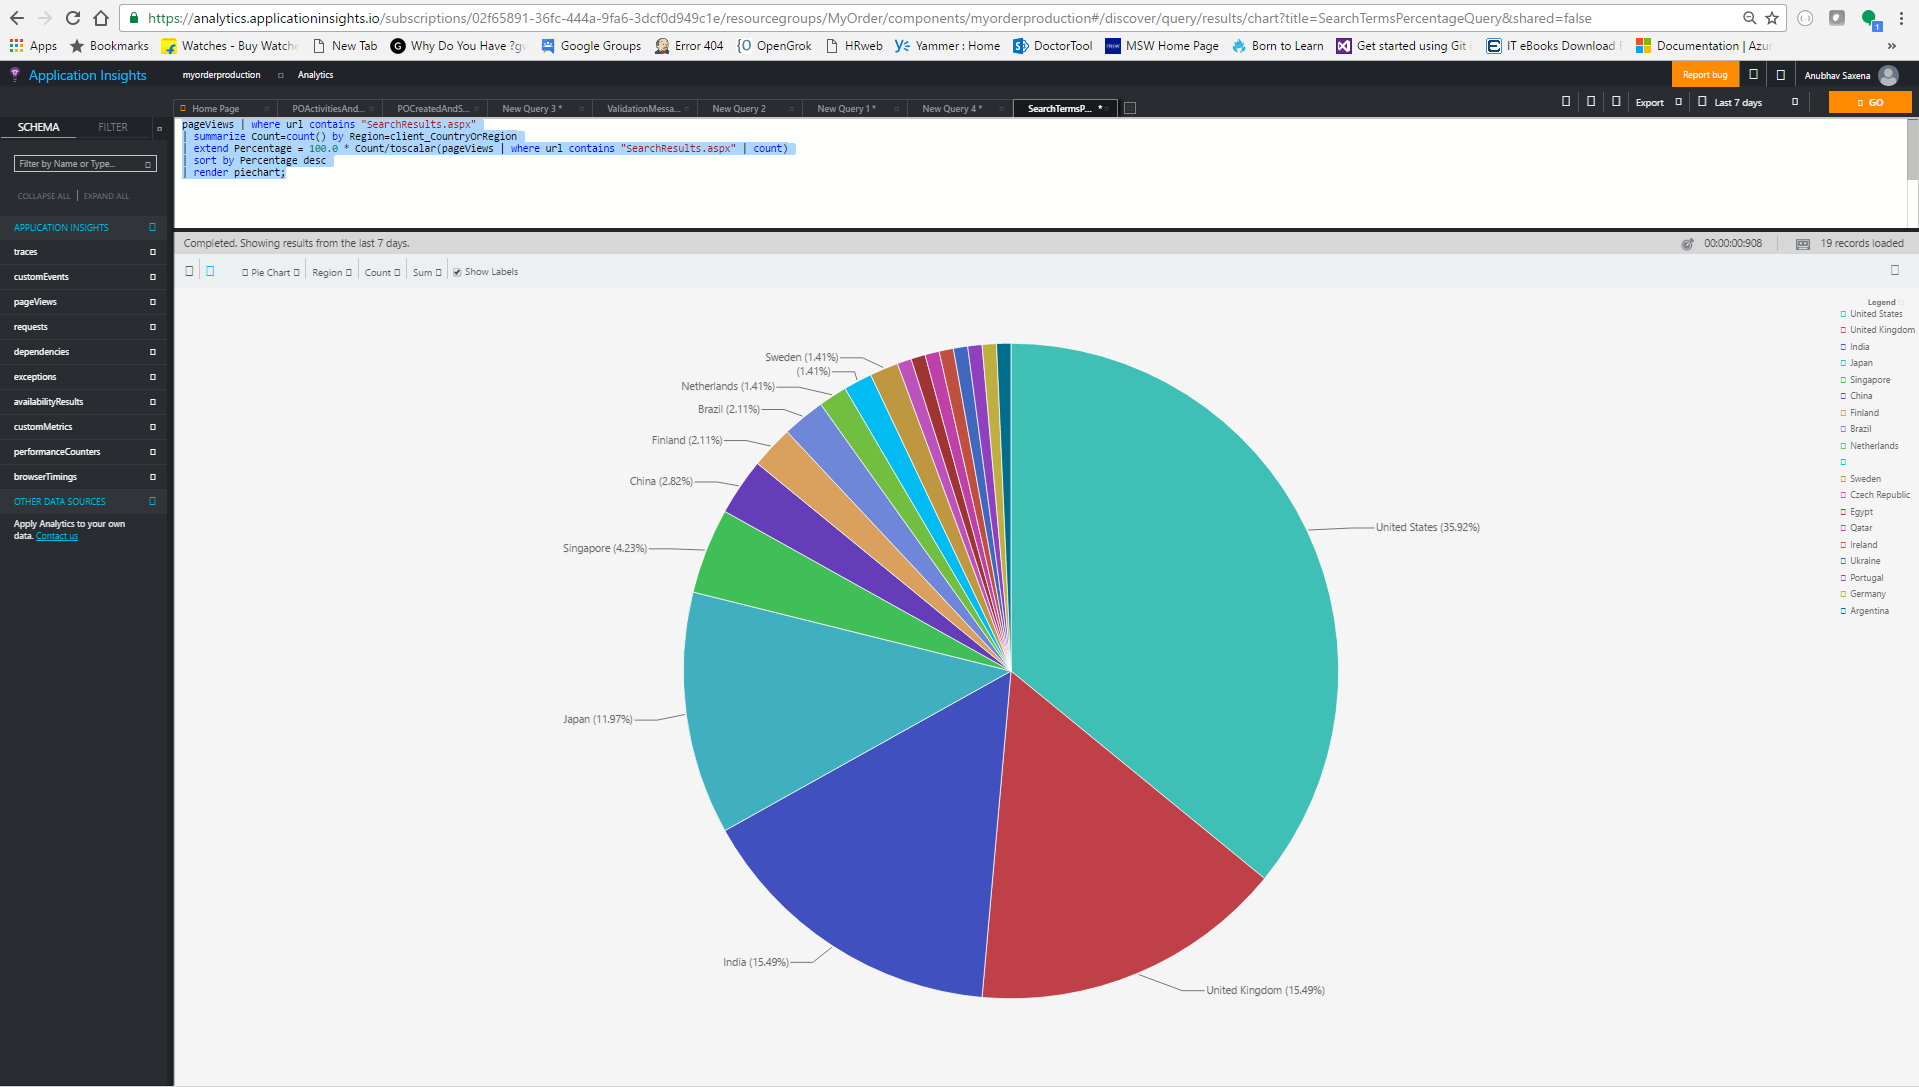
In the last 7 days, which are the regions where MyOrder users have initiated a search?
pageViews | where url contains "SearchResults.aspx"
| summarize Count=count() by Region=client_CountryOrRegion
| extend Percentage = 100.0 * Count/toscalar(pageViews | where url contains "SearchResults.aspx" | count)
| sort by Percentage desc
| render piechart;
What is <not collected> in our reports?
Look at the Browser Version and Operating System Reports which show a category "<not collected>". What exactly is this? I am in discussion with Kusto Team to figure this out.
