Welcome to Tabular Projects
With SQL Server “Denali” CTP3, there are two types of Analysis Services projects in Business Intelligence Development Studio (BIDS). You can create and edit the multidimensional projects that you all know and love. You can also use BIDS to create tabular projects. This post will focus on getting you up and running in tabular development.
Setup
Here is what you need to install to get up and running with the tabular project tools:
- Install BIDS (now in the Visual Studio 2010 shell).
- Install an Analysis Services instance running in tabular mode. BIDS will connect to this server while you are modeling, reading from and writing to temporary databases. You must be an administrator on this server (called the workspace database server). It is best if this instance is on the same machine as BIDS.
You should probably have both SSMS and a version of Office on the machine with BIDS and the workspace database server. This allows you to browse and administer your models while you are working. However, if this machine configuration doesn’t work for you, you can always browse or administer your tabular databases remotely. Just open port 2383 on the firewall on the machine hosting the workspace database instance and you’re good to go.
See the release notes for some more details about setup.
Finding your way around the designer
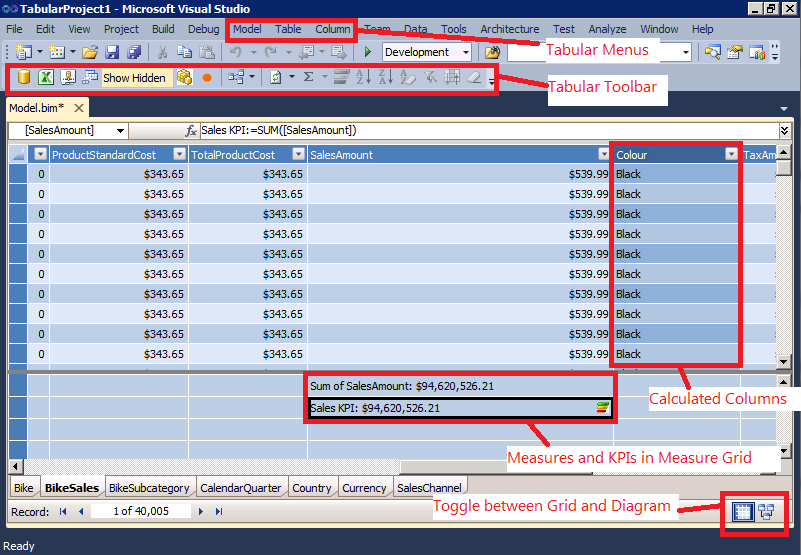
The designer is pretty straightforward. There are three menus (Model, Table and Column) that contain most commands used during tabular modeling. There is also a toolbar that provides quick access to some frequently used commands. Inside the designer, there are two views - the grid view and the diagram view.
Here’s an annotated picture of the grid view, showing the menus and toolbars. You’ll spend a lot of time in the grid view, creating calculated columns in the grid and writing measures and KPIs in the measure grid.
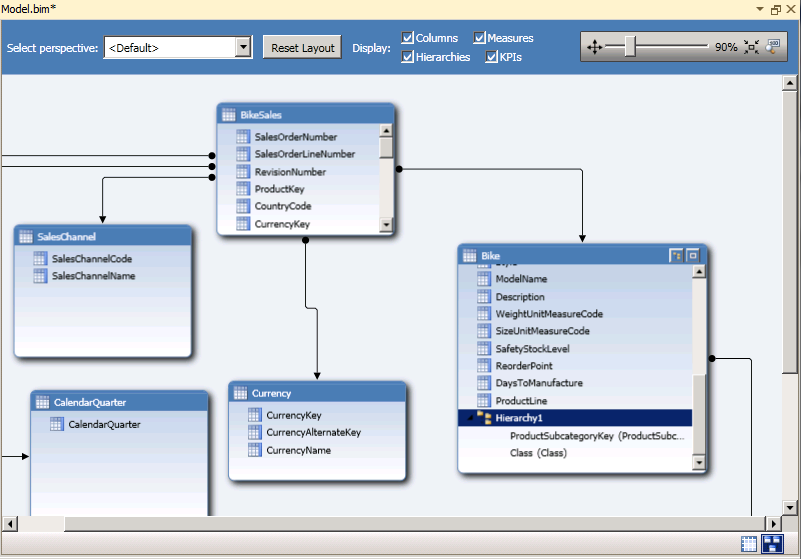
The other view is the diagram view, which you will use for creating relationships and hierarchies.
You can create perspectives, partitions and roles from either view. You can perform most metadata operations, such as changing data types, applying reporting properties, marking a date table, and so on from either view. Keep your property grid open, you’ll use it pretty frequently to make metadata changes.
Your first model
The documentation team put together a pretty thorough tutorial that will help you get up and running. Here’s a few things not covered in the tutorial:
· You can get started in the tabular designer by importing an existing PowerPivot workbook. In the File->New Project dialog, choose the “Import from PowerPivot” template under the Analysis Services node.
· To build DirectQuery models, you must enable DirectQuery mode in the designer first.
· You’ll need to get familiar with DAX in a hurry. There is a DAX overview on MSDN that provides basic conceptual information and function reference. For more in-depth information, you can consult the DAX resources we have for PowerPivot users. Two nice resources are the DAX whitepaper and the TechEd talk on DAX. For people familiar with DAX that are wondering what’s new for Denali, see the PowerPivot release notes for a list of new functions.
Have fun with the bits. We look forward to hearing your comments, suggestions, and bug reports. Kay’s post yesterday explains how to give feedback, file early and often. Cheers

