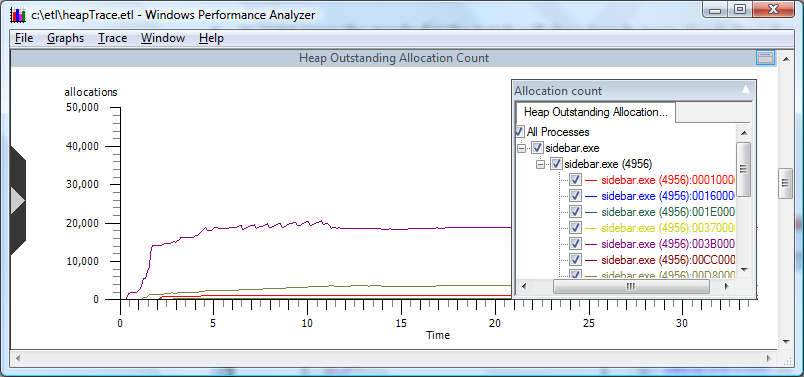
Heap Outstanding Allocation Count
The following screen shot displays a graph showing the heap outstanding allocation.

The steepness of the line slopes are indications of an increase in the number of allocations.
Allocations that have short lifetimes are displayed by ripples on the graph plots.
Frequent ripples indicate variances in the number of allocations. Plots having frequent ripples are indicative of transient allocations.