Customizing the View Using the Context Menu
The context menu allows you to customize data within a graph. Right click anywhere on the graph to open the context menu.
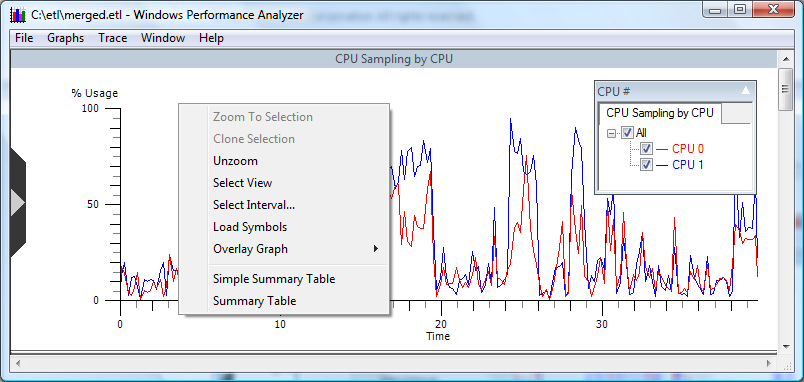
The following screen shot displays a graph showing a CPU Sampling with the context menu open.

The context menu includes the following selections:
Zoom to Selection - Changes the view to display only the currently selected time interval. This option is not available if there is no time interval selection.
Clone Selection - Copies the time interval selection of the current graph to all the other graphs in the same window. This option is not present if there is no time interval selection.
Unzoom - Reverts the view of all graphs in the window to display original time interval.
- **Note on Zooming and Unzooming** - To dynamically zoom and unzoom, press and hold the control key while rotating the mouse wheel.
Select View - Selects the entire current view for analysis. Typically this option is used in conjunction with summary tables.
Select Interval - Sets the bounds of the selection interval to any given numerical time values.
Load Symbols - Enables or disables symbol decoding.
Overlay Graph - Adds or removes an overlay of any other graph on top of the current graph.
Simple Summary Table -Presents a simplified rendering of call stack data. This option appears only when the captured data supports simplified analysis.
Summary Table - Displays a highly-flexible tabular view of the information corresponding to the graph. In the case of overlays, the Summary Table options on the main context menu refer to the original graph, while the overlaid graphs are shown on a submenu. For more information on summary tables please see the Summary Tables section of this document.