How to trigger suspend, resume, and background events while debugging UWP apps in Visual Studio
Applies to: ![]() Visual Studio
Visual Studio ![]() Visual Studio for Mac
Visual Studio for Mac
Note
This article applies to Visual Studio 2017. If you're looking for the latest Visual Studio documentation, see Visual Studio documentation. We recommend upgrading to the latest version of Visual Studio. Download it here
When you are not debugging, Windows Process Lifetime Management (PLM) controls the execution state of your app—starting, suspending, resuming, and terminating the app in response to user actions and the state of the device. When you are debugging, Windows disables these activation events. This topic describes how to fire these events in the debugger.
This topic also describes how to debug Background tasks. Background tasks enable you to perform certain operations in a background process, even when your app is not running. You can use the debugger to put your app in debug mode and then— without starting the UI—start and debug the background task.
For more information about Process Lifetime Management and background tasks, see Launching, resuming, and multitasking.
Trigger Process Lifetime Management events
Windows can suspend your app when the user switches away from it or when Windows enters a low-power state. You can respond to the Suspending event to save relevant app and user data to persistent storage and to release resources. When an app is resumed from the Suspended state, it enters the Running state and continues from where it was when it was suspended. You can respond to the Resuming event to restore or refresh application state and reclaim resources.
Although Windows attempts to keep as many suspended apps in memory as possible, Windows can terminate your app if there aren't enough resources to keep it in memory. A user can also explicitly close your app. There's no special event to indicate that the user has closed an app.
In the Visual Studio debugger, you can manually suspend, resume, and terminate your apps to debug process lifecycle events. To debug a process lifecycle event:
Set a breakpoint in the handler of the event that you want to debug.
Press F5 to start debugging.
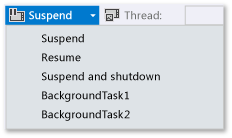
On the Debug Location toolbar, choose the event that you want to fire:

Suspend and terminate closes the app and ends the debug session.
Trigger background tasks
Any app can register a background task to respond to certain system events, even when the app is not running. Background tasks can't run code that directly updates the UI; instead, they show information to the user with tile updates, badge updates, and toast notifications. For more information, see Supporting your app with background tasks.
You can trigger the events that start background tasks for your app from the debugger.
Note
The debugger can trigger only those events that do not contain data, such as events that indicate a change of state in the device. You have to manually trigger background tasks that require user input or other data.
The most realistic way to trigger a background task event is when your app is not running. However, triggering the event in a standard debugging session is also supported.
Trigger a background task event from a standard debug session
Set a breakpoint in the background task code that you want to debug.
Press F5 to start debugging.
From the events list on the Debug Location toolbar, choose the background task that you want to start.

Trigger a background task when the app is not running
Set a breakpoint in the background task code that you want to debug.
Open the debug property page for the start-up project. In Solution Explorer, select the project. On the Debug menu, choose Properties.
For C++ projects, expand Configuration Properties and then choose Debugging.
Do one of the following:
For Visual C# and Visual Basic projects, choose Do not launch, but debug my code when it starts

For C++ projects, choose No from the Launch application list.

Press F5 to put the app in debug mode. Note the Process list on the Debug Location toolbar displays the app package name to indicate that you are in debug mode.

From the events list on the Debug Location toolbar, choose the background task that you want to start.

Trigger Process Lifetime Management events and background tasks from an installed app
Use the Debug Installed App Package dialog box to load an app that is already installed into the debugger. For example, you might debug an app that was installed from Microsoft Store, or debug an app when you have the source files for the app, but not a Visual Studio project for the app. The Debug Installed App Package dialog box allows you to start an app in debug mode on the Visual Studio machine or on a remote device, or to set the app to run in debug mode but not start it. For more information, see Debug an installed app package.
Once the app is loaded into the debugger, you can use any of the procedures described above.
Diagnosing background task activation errors
The diagnostic logs in Windows Event Viewer for the background infrastructure contain detailed information that you can use to diagnose and troubleshoot background task errors. To view the log:
Open the Event Viewer application.
In the Actions pane, choose View and make sure Show Analytic and Debug Logs is checked.
On the Event Viewer (Local) tree, expand the nodes Applications and Services Logs > Microsoft > Windows > BackgroundTasksInfrastructure.
Choose the Diagnostic log.