Monitorar o Azure Local com as métricas do Azure Monitor
Aplicável ao: Azure Local 2311.2 e posteriores
Este artigo descreve como monitorar seu sistema local do Azure com as métricas do Azure Monitor. Ele também fornece uma lista abrangente de métricas coletadas para recursos de computação, armazenamento e rede no Azure Local.
Quando você tem aplicativos e processos de negócios críticos que dependem de recursos do Azure, é importante monitorar a disponibilidade, o desempenho e a operação desses recursos. A integração das Métricas do Azure Monitor com o Azure Local permite que você armazene dados numéricos de seus clusters em um banco de dados de série temporal dedicado. Esse banco de dados é criado automaticamente para cada assinatura do Azure. Use o gerenciador de métricas para analisar dados do sistema local do Azure e avaliar sua integridade e utilização.
Reserve alguns minutos para assistir ao vídeo passo a passo sobre como criar gráficos de métricas no Metrics Explorer e alertas usando o Metrics:
Benefícios
Aqui estão os benefícios de usar o Metrics for Azure Local:
Sem custo adicional. Essas métricas são recursos padrão prontos para uso que são coletados e fornecidos automaticamente a você sem custo adicional.
Insights quase em tempo real. Você tem a capacidade de observar métricas prontas para uso e correlacionar tendências usando dados quase em tempo real.
Personalização. Você pode criar seus próprios gráficos e personalizá-los por meio da funcionalidade de agregação e filtro. A tarefa de salvar e compartilhar seus gráficos de métricas via Excel, pastas de trabalho ou enviá-los para o Grafana é simples.
Regras de alerta personalizadas. Você pode escrever regras de alerta personalizadas nas métricas para monitorar com eficiência a integridade do sistema local do Azure.
Pré-requisitos
Aqui estão os pré-requisitos para usar o Metrics for Azure Local:
Você deve ter acesso a um sistema local do Azure implantado, registrado e conectado ao Azure.
A
AzureEdgeTelemetryAndDiagnosticsextensão deve ser instalada para coletar informações de telemetria e diagnóstico do sistema local do Azure. Para obter mais informações sobre a extensão, consulte Visão geral da extensão de telemetria e diagnóstico local do Azure.
Monitore o Azure Local por meio da guia Monitoramento
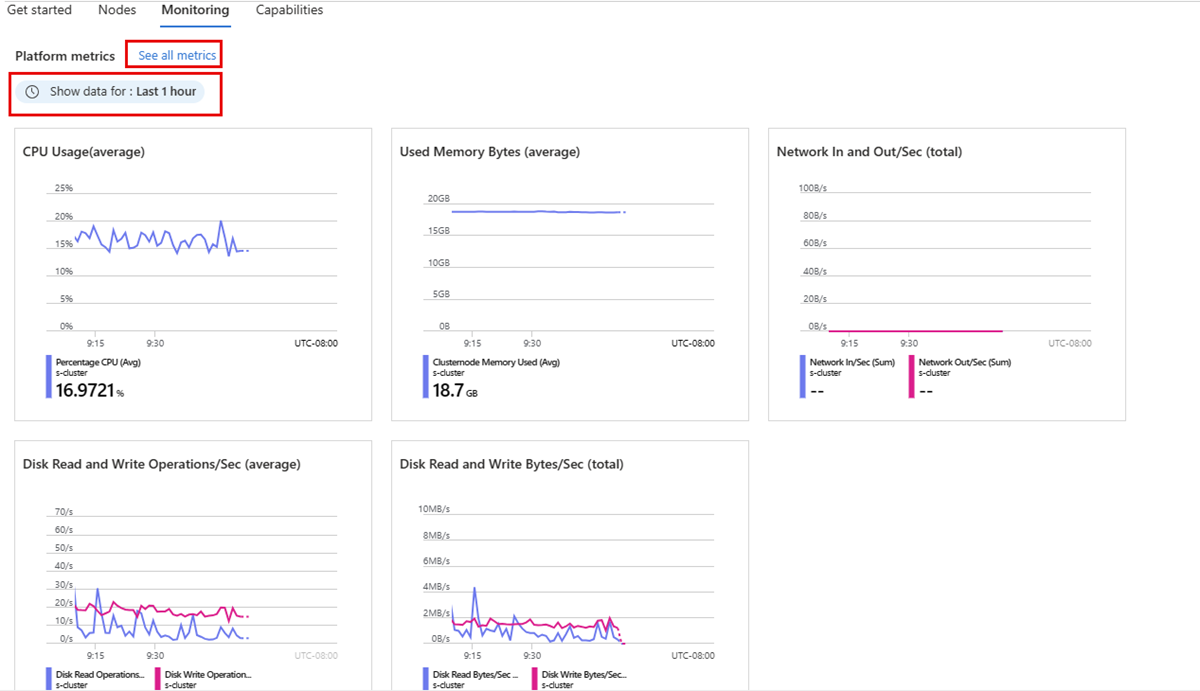
No portal do Azure, você pode monitorar as métricas da plataforma do cluster navegando até a guia Monitoramento na página Visão geral do cluster. Essa guia oferece uma maneira rápida de visualizar gráficos para diferentes métricas de plataforma. Você pode selecionar qualquer um dos gráficos para analisar melhor os dados no Metrics Explorer.
Siga estas etapas para monitorar as métricas da plataforma do seu sistema no portal do Azure:
Vá para a página de recursos de cluster local do Azure e selecione seu cluster.
Na página Visão geral do cluster, selecione a guia Monitoramento .
No painel Métricas da plataforma, revise os gráficos que exibem as métricas da plataforma. Para saber as métricas que o Azure Monitor coleta para preencher esses grafos, consulte Métricas para os grafos da guia Monitoramento.
Na parte superior do painel, selecione uma duração para alterar o intervalo de tempo dos gráficos.
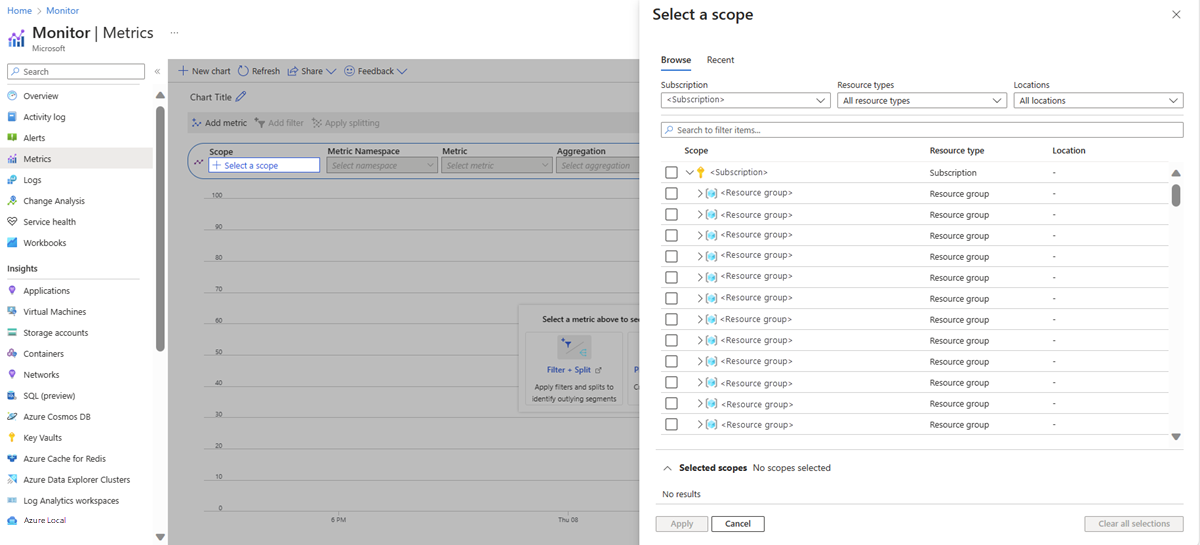
Selecione o link Ver todas as métricas para analisar métricas usando o gerenciador de métricas. Consulte Analisar métricas.
Selecione qualquer um dos gráficos para abri-los no Metrics Explorer para fazer uma busca detalhada ou criar uma regra de alerta. Consulte Criar alertas de métricas.
Analisar métricas
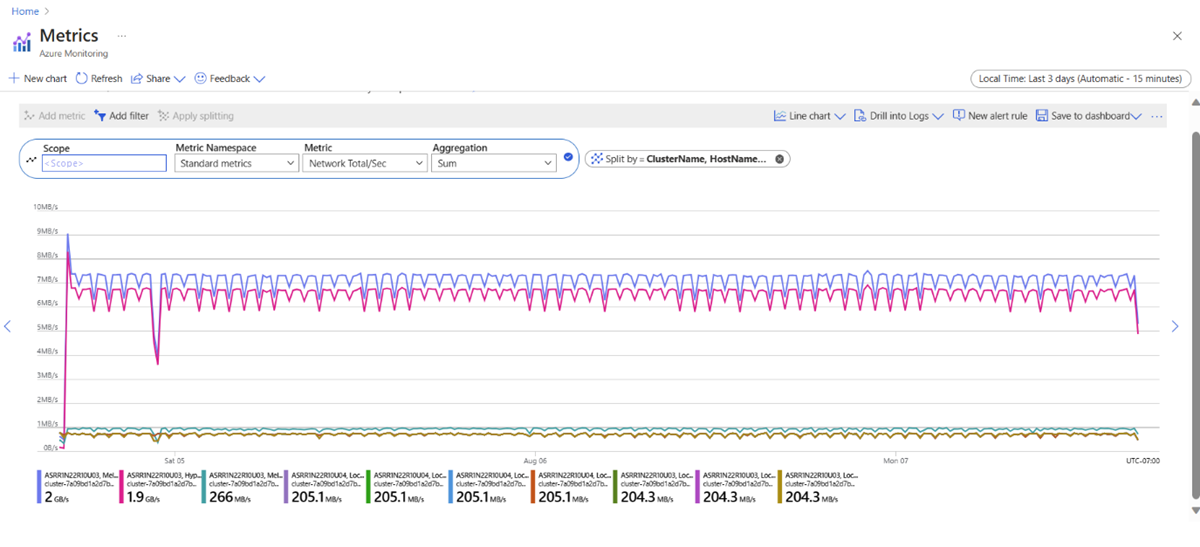
Você pode usar o Metrics Explorer para analisar interativamente os dados em seu banco de dados de métricas e traçar os valores de várias métricas ao longo do tempo. Para abrir o gerenciador de métricas no portal do Azure, selecione Métricas na seção Monitoramento.
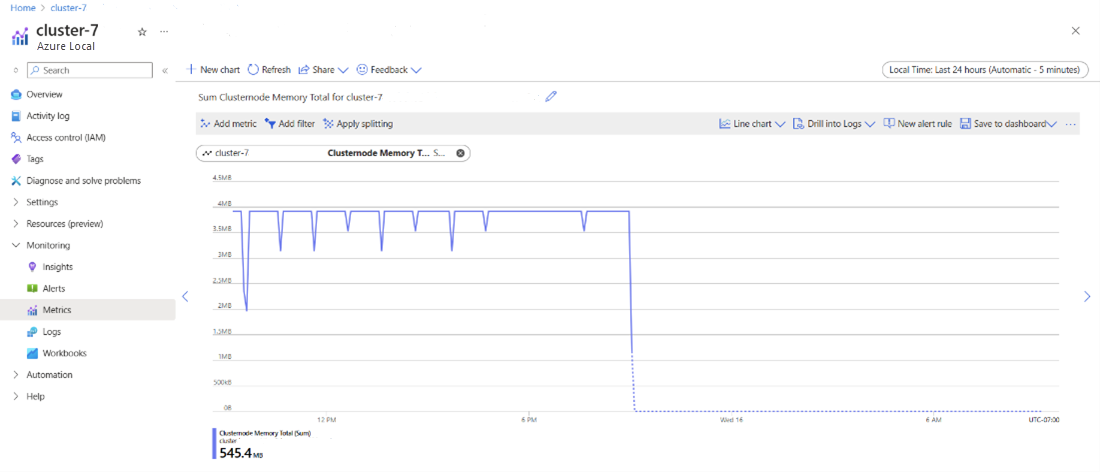
Você também pode acessar as Métricas diretamente do menu dos serviços locais do Azure.
Com o Metrics, você pode criar gráficos a partir de valores de métricas e correlacionar tendências visualmente. Você também pode criar uma regra de alerta de métrica ou fixar um gráfico em um painel do Azure para exibi-los com outras visualizações. Para ver um tutorial de como usar essa ferramenta, consulte Analisar métricas de um recurso do Azure.
As métricas da plataforma são armazenadas por 93 dias, no entanto, você só pode consultar (no bloco Métricas ) um máximo de 30 dias de dados em um único gráfico. Para saber mais sobre retenção de dados, consulte Métricas no Azure Monitor.
Analisar métricas para um cluster específico
Siga estas etapas para analisar métricas para um cluster local do Azure específico no portal do Azure:
Vá para o cluster local do Azure e navegue até a seção Monitoramento .
Para analisar métricas, selecione a opção Métricas . Seu cluster já estará preenchido na seção scope. Selecione a métrica que deseja analisar.
Para criar alertas, selecione a opção Alertas e configure alertas conforme descrito em Criar alertas de métrica.
Quais métricas são coletadas?
Esta seção lista as métricas de plataforma coletadas para o cluster local do Azure, os tipos de agregação e as dimensões disponíveis para cada métrica. Para obter mais informações sobre quais são as dimensões métricas, confira Métricas multidimensionais.
Métricas para os gráficos da guia Monitoramento
A tabela a seguir lista as métricas que o Azure Monitor coleta para preencher os gráficos na guia Monitoramento:
| Métricas | Unidade |
|---|---|
| Porcentagem de CPU | Percentual |
| Entrada de rede/s | BytesPerSecond |
| Saída de rede/s | BytesPerSecond |
| Disk Read Bytes/Sec | BytesPerSecond |
| Disk Write Bytes/Sec | BytesPerSecond |
| Operações de leitura de disco/Seg | CountPerSecond |
| Operações de gravação de disco/Seg | CountPerSecond |
| Bytes de memória usados | Bytes |
Métricas para nós
| Métrica | Descrição | Unidade | Tipo de agregação padrão | Tipo de agregação com suporte | Dimensões |
|---|---|---|---|---|---|
| Porcentagem de CPU | Porcentagem de tempo do processador que não está ocioso. | Percentual | Máximo | Mínimo, Máximo, Média, Soma, Contagem | Cluster, Nó |
| Porcentagem de convidado da CPU | Porcentagem de tempo do processador usado para a demanda de convidado (máquina virtual). | Percentual | Máximo | Mínimo, Máximo, Média, Soma, Contagem | Cluster, Nó |
| Porcentagem de host da CPU | Porcentagem de tempo do processador usado para a demanda do host. | Percentual | Máximo | Mínimo, Máximo, Média, Soma, Contagem | Cluster, Nó |
| Memória Total do nó do cluster | A memória física total do nó. | Bytes | Somar | Mínimo, Máximo, Média | Cluster, Nó |
| Memória do nó de cluster disponível | A memória disponível do nó. | Bytes | Máximo | Mínimo, Máximo, Média | Cluster, Nó |
| Memória do nó do cluster usada | A memória usada do nó. | Bytes | Máximo | Mínimo, Máximo | Cluster, Nó |
| Porcentagem de Memória | A memória alocada (não disponível) do nó. | Percentual | Máximo | Mínimo, Máximo, Soma, Contagem | Cluster, Nó |
| Porcentagem de Memória Convidado | A memória alocada para a demanda de convidado (máquina virtual). | Percentual | Máximo | Mínimo, Máximo, Média, Soma, Contagem | Cluster, Nó, LUN, VM |
| Porcentagem de memória do host | A memória alocada para a demanda de host. | Percentual | Máximo | Mínimo, Máximo, Soma, Contagem | Cluster, Nó |
| Cache Csv do nó de cluster Read Hit | O cache atingiu PerSecond para operações de leitura. | CountPerSecond | Máximo | Mínimo, Máximo, Soma, Contagem | Cluster, Nó, LUN |
| Taxa de acertos de leitura do cache Csv do nó de cluster | Taxa de acertos do cache para operações de leitura. | Percentual | Máximo | Mínimo, Máximo, Soma, Contagem | Cluster, Nó, LUN |
| Cache Csv do nó de cluster Ler Perder | Cache missPerSecond para operações de leitura. | CountPerSecond | Máximo | Mínimo, Máximo, Soma, Contagem | Cluster, Nó, LUN |
| Armazenamento do nó do cluster degradado | Número total de unidades com falha ou ausentes no pool de armazenamento. | Bytes | Somar | Mínimo, Máximo, Soma, Contagem | Cluster, Nó |
Métricas para unidades
| Métrica | Descrição | Unidade | Tipo de agregação padrão | Tipo de agregação com suporte | Dimensões |
|---|---|---|---|---|---|
| Operações de leitura de disco físico/s | Número de operações de leitura por segundo concluídas pela unidade. | CountPerSecond | Máximo | Mínimo, Máximo, Média, Soma, Contagem | Cluster, Nó, LUN |
| Operações de gravação de disco físico/s | Número de operações de gravação por segundo concluídas pela unidade. | CountPerSecond | Máximo | Mínimo, Máximo, Média, Soma, Contagem | Cluster, Nó, LUN |
| Operações de leitura e gravação de disco físico/s | Número total de operações de leitura ou gravação por segundo concluídas pela unidade. | CountPerSecond | Somar | Mínimo, Máximo, Média, Soma, Contagem | Cluster, Nó, LUN |
| Bytes de leitura de disco físico/s | Quantidade de dados lidos na unidade por segundo. | BytesPerSecond | Máximo | Mínimo, Máximo, Média, Soma, Contagem | Cluster, Nó, LUN |
| Bytes de gravação de disco físico/s | Quantidade de dados gravados na unidade por segundo. | BytesPerSecond | Máximo | Mínimo, Máximo, Média, Soma, Contagem | Cluster, Nó, LUN |
| Leitura e gravação de disco físico | Quantidade total de dados lidos na unidade por segundo. | BytesPerSecond | Somar | Mínimo, Máximo, Média, Soma, Contagem | Cluster, Nó, LUN |
| Leitura de latência de disco físico | Latência média das operações de leitura na unidade. | Segundos | Máximo | Mínimo, Máximo, Média, Soma | Cluster, Nó, LUN |
| Gravação de latência de disco físico | Latência média das operações de gravação na unidade. | Segundos | Máximo | Mínimo, Máximo, Média, Soma | Cluster, Nó, LUN |
| Média de latência do disco físico | Latência média de todas as operações na unidade. | Segundos | Máximo | Mínimo, Máximo, Média, Soma | Cluster, Nó, LUN |
| Capacidade do disco físico Tamanho Total | A capacidade total de armazenamento da unidade. | Bytes | Somar | Mínimo, Máximo, Média | Cluster, Nó, LUN |
| Tamanho da capacidade do disco físico usado | A capacidade de armazenamento usada da unidade. | Bytes | Máximo | Mínimo, Máximo, Média, Soma, Contagem | Cluster, Nó, LUN |
Métricas para adaptadores de rede
| Métrica | Descrição | Unidade | Tipo de agregação padrão | Tipo de agregação com suporte | Dimensões |
|---|---|---|---|---|---|
| Entrada de rede/s | Taxa de dados recebidos pelo adaptador de rede. | Bytes por segundo | Máximo | Mínimo, Máximo, Média, Soma, Contagem | Cluster, Nó, Adaptador de Rede, LUN |
| Saída de rede/s | Taxa de dados enviados pelo adaptador de rede. | Bytes por segundo | Máximo | Mínimo, Máximo, Média, Soma, Contagem | Cluster, Nó, Adaptador de Rede, LUN |
| Total da rede/s | Taxa total de dados recebidos ou enviados pelo adaptador de rede. | Bytes por segundo | Somar | Mínimo, Máximo, Média, Soma, Contagem | Cluster, Nó, Adaptador de Rede, LUN |
| Largura de banda do adaptador de rede Rdma de entrada | Taxa de dados recebidos pelo RDMA por meio do adaptador de rede. | Bytes por segundo | Máximo | Mínimo, Máximo, Média, Soma, Contagem | Cluster, Nó, Adaptador de Rede, LUN |
| Saída de largura de banda do adaptador de rede | Taxa de dados enviados pelo RDMA por meio do adaptador de rede. | Bytes por segundo | Máximo | Mínimo, Máximo, Média, Soma, Contagem | Cluster, Nó, Adaptador de Rede, LUN |
| Largura de banda do adaptador de rede Rdma Total | Taxa total de dados recebidos ou enviados pelo RDMA por meio do adaptador de rede. | Bytes por segundo | Somar | Mínimo, Máximo, Soma, Contagem | Cluster, Nó, Adaptador de Rede, LUN |
Métricas para VHDs
| Métrica | Descrição | Unidade | Tipo de agregação padrão | Tipo de agregação com suporte | Dimensões |
|---|---|---|---|---|---|
| Operações de leitura de VHD/s | Número de operações de leitura por segundo concluídas pelo disco rígido virtual. | Contagem por segundo | Máximo | Mínimo, Máximo, Média, Soma, Contagem | Cluster, Nó, VHD |
| Operações de gravação VHD/s | Número de operações de gravação por segundo concluídas pelo disco rígido virtual. | Contagem por segundo | Máximo | Mínimo, Máximo, Média, Soma, Contagem | Cluster, Nó, VHD |
| Operações de leitura e gravação de VHD/s | Número total de operações de leitura ou gravação por segundo concluídas pelo disco rígido virtual. | Contagem por segundo | Somar | Mínimo, Máximo, Soma, Contagem | Cluster, Nó, VHD |
| Bytes de leitura de VHD/s | Quantidade de dados lidos do disco rígido virtual por segundo. | Bytes por segundo | Máximo | Mínimo, Máximo, Média, Soma, Contagem | Cluster, Nó, VHD |
| Bytes de gravação VHD/s | Quantidade de dados gravados no disco rígido virtual por segundo. | Bytes por segundo | Máximo | Mínimo, Máximo, Média, Soma, Contagem | Cluster, Nó, VHD |
| Bytes de leitura e gravação de VHD/s | Quantidade total de dados lidos no disco rígido virtual por segundo. | Bytes por segundo | Somar | Mínimo, Máximo, Soma, Contagem | Cluster, Nó, VHD |
| Média de latência do VHD | Latência média de todas as operações no disco rígido virtual. | Segundos | Máximo | Mínimo, Máximo, Média, Soma | Cluster, Nó, VHD |
| Tamanho VHD Corrente | O tamanho do arquivo atual do disco rígido virtual, se estiver expandindo dinamicamente. Se corrigido, a série não é coletada. | Bytes | Máximo | Mínimo, Máximo, Média | Cluster, Nó, Instância |
| Tamanho máximo do VHD | O tamanho máximo do disco rígido virtual, se estiver expandindo dinamicamente. | Bytes | Máximo | Mínimo, Máximo, Média | Cluster, Nó, VHD |
Métricas para VMs
| Métrica | Descrição | Unidade | Tipo de agregação padrão | Tipo de agregação com suporte | Dimensões |
|---|---|---|---|---|---|
| Porcentagem de CPU da VM | Porcentagem que a máquina virtual está usando do(s) processador(es) do nó host. | Percentual | Máximo | Mínimo, Máximo, Soma, Contagem | Cluster, Nó, VM |
| Memória da VM atribuída | A quantidade de memória atribuída à máquina virtual. | Bytes | Somar | Mínimo, Máximo | Cluster, Nó, LUN, VM |
| Memória da VM disponível | A quantidade de memória que permanece disponível, com relação à quantidade atribuída. | Bytes | Máximo | Mínimo, Máximo, Soma, Contagem | Cluster, Nó, VM, LUN |
| Memória da VM usada | Memória da VM usada | Bytes | Máximo | Mínimo, Máximo | Cluster, Nó, VM, LUN |
| Máximo de memória da VM | Se estiver usando memória dinâmica, essa é a quantidade máxima de memória que pode ser atribuída à máquina virtual. | Bytes | Máximo | Mínimo, Máximo, Média | Cluster, Nó, LUN, VM |
| Memória mínima da VM | Se estiver usando memória dinâmica, essa é a quantidade mínima de memória que pode ser atribuída à máquina virtual. | Bytes | Mínimo | Mínimo, Máximo, Média | Cluster, Nó, LUN, VM |
| Pressão de memória da VM | A taxa de memória exigida pela máquina virtual em relação à memória alocada à máquina virtual. | Bytes | Máximo | Mínimo, Máximo, Média | Cluster, Nó, LUN, VM |
| Inicialização da memória da VM | A quantidade de memória necessária para a máquina virtual ser iniciada. | Bytes | Máximo | Mínimo, Máximo, Média | Cluster, Nó, LUN, VM |
| Total de memória da VM | Memória total. | Bytes | Máximo | Mínimo, Máximo, Média | Cluster, Nó, VM, LUN |
| Adaptador de rede VM Entrada de rede/s | Taxa de dados recebidos pela máquina virtual em todos os adaptadores da rede virtual. | Bits por segundo | Máximo | Mínimo, Máximo, Média, Soma, Contagem | Cluster, Nó, Adaptador de Rede Virtual |
| Adaptador de rede VM Saída de rede/s | Taxa de dados enviados pela máquina virtual em todos os adaptadores da rede virtual. | Bits por segundo | Máximo | Mínimo, Máximo, Média, Soma, Contagem | Cluster, Nó, Adaptador de Rede Virtual |
| Adaptador de rede VM Entrada e Saída de Rede/s | Taxa total de dados recebidos ou enviados pela máquina virtual em todos os adaptadores da rede virtual. | Bits por segundo | Máximo | Mínimo, Máximo, Média, Soma, Contagem | Cluster, Nó, Adaptador de Rede Virtual |
Métricas para volumes
| Métrica | Descrição | Unidade | Tipo de agregação padrão | Tipo de agregação com suporte | Dimensões |
|---|---|---|---|---|---|
| Operações de leitura de disco/Seg | Número de operações de leitura por segundo concluídas por esse volume. | Contagem por segundo | Máximo | Mínimo, Máximo, Média, Soma, Contagem | Cluster, Nó, LUN |
| Operações de gravação de disco/Seg | Número de operações de gravação por segundo concluídas por esse volume. | Contagem por segundo | Máximo | Mínimo, Máximo, Média, Soma, Contagem | Cluster, Nó, LUN |
| Operações de leitura e gravação de disco/s | Número total de operações de leitura ou gravação por segundo concluídas por esse volume. | Contagem por segundo | Somar | Mínimo, Máximo, Soma, Contagem | Cluster, Nó, LUN |
| Disk Read Bytes/Sec | Quantidade de dados lidos nesse volume por segundo. | Bytes por segundo | Máximo | Mínimo, Máximo, Média, Soma, Contagem | Cluster, Nó, LUN |
| Disk Write Bytes/Sec | Quantidade de dados gravados nesse volume por segundo. | Bytes por segundo | Máximo | Mínimo, Máximo, Média, Soma, Contagem | Cluster, Nó, LUN |
| Leitura e gravação de disco | Quantidade total de dados lidos por ou gravados nesse volume por segundo. | Bytes por segundo | Somar | Mínimo, Máximo, Soma, Contagem | Cluster, Nó, LUN |
| Leitura de latência de volume | Latência média das operações de leitura nesse volume. | Segundos | Máximo | Mínimo, Máximo, Média, Soma | Cluster, Nó, LUN |
| Gravação de latência de volume | Latência média das operações de gravação nesse volume. | Segundos | Máximo | Mínimo, Máximo, Média, Soma | Cluster, Nó, LUN |
| Média de latência de volume | Latência média de todas as operações relacionadas a esse volume. | Segundos | Máximo | Mínimo, Máximo, Soma | Cluster, Nó, LUN |
| Volume Tamanho Total | A capacidade total de armazenamento do volume. | Bytes | Somar | Mínimo, Máximo, Média | Cluster, Nó, LUN |
| Tamanho do volume disponível | A capacidade de armazenamento disponível do volume. | Bytes | Máximo | Mínimo, Máximo, Média, Soma, Contagem | Cluster, Nó, LUN |
Para ver informações detalhadas sobre como essas métricas são coletadas, consulte Histórico de desempenho para Espaços de Armazenamento Diretos.


