New UI Performance Analysis Tool for WPF Applications
In Visual Studio 2013, we added a new XAML UI Responsiveness tool in the performance and diagnostics hub to enable you to analyze application interaction-related performance issues in your XAML Windows Store applications. Since then, we’ve gotten a number of requests to support WPF applications. We’re excited to announce that we have built a new Application Timeline tool which is a replacement for the existing XAML UI Responsiveness tool that supports WPF applications in Visual Studio 2015 CTP 5. Current support is limited to WPF (.NET 4.0 and above) and Windows Store 8.1 applications running on Windows 8.1 or later. We are exploring adding support for Windows 7 in a future release of Visual Studio.
Why use the new profiling tool?
Performance is a critical aspect of any enterprise WPF application. Customers expect applications to load fast, as well as interactions with them to be jitter free and fluid. The Application Timeline tool helps you improve the performance of your WPF applications by providing a semantically-rich, scenario centric view of your applications’ resource consumption. You can analyze the time spent by your application preparing UI frames, servicing network and disk requests, and much more in scenarios like Application Startup and Page Load. This post briefly highlights the features of this tool.
Profiling an application
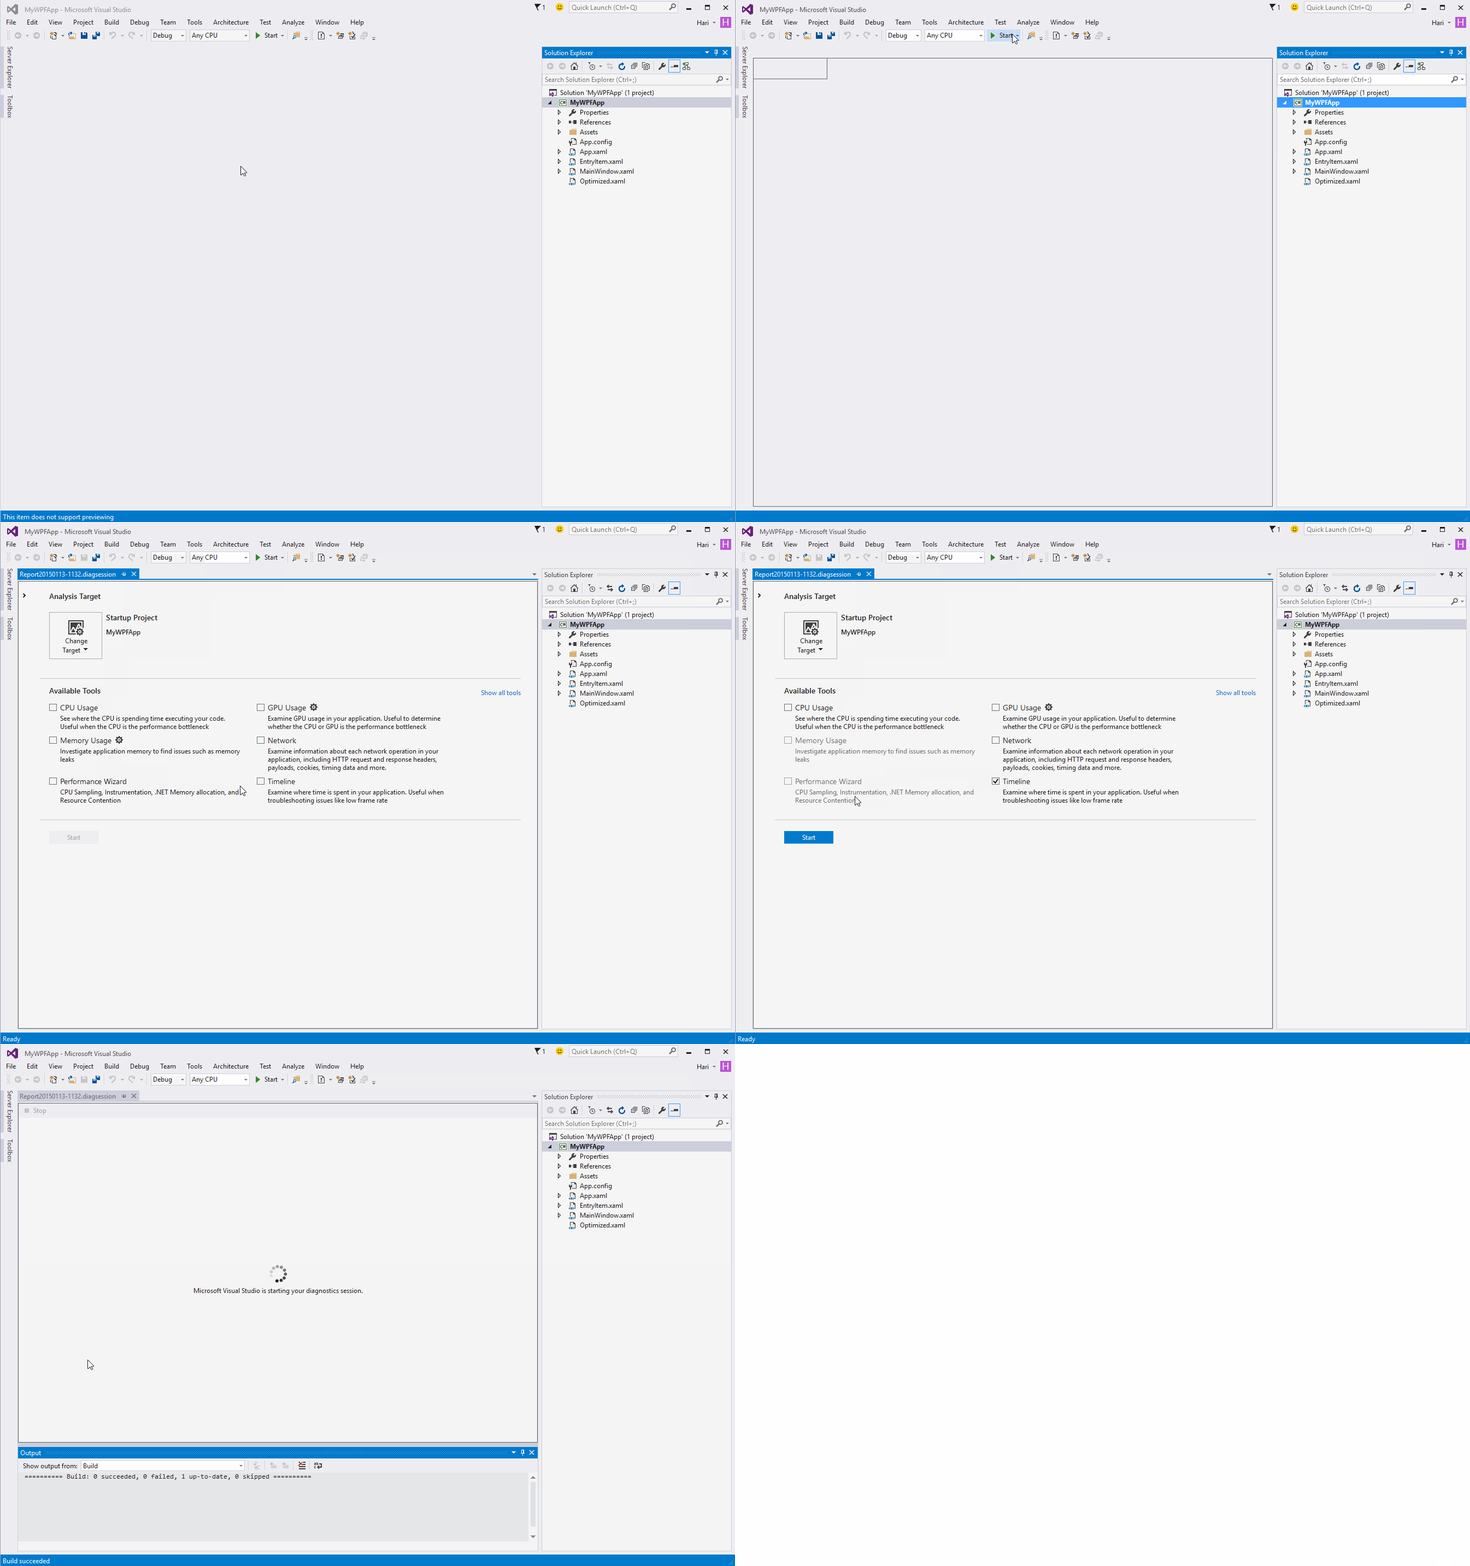
To profile a WPF application in Visual Studio 2015 CTP 5, open the Performance and Diagnostics hub from the Debug -> Start Diagnostic Tools Without Debugging (ALT+F2) menu. Select the Application Timeline tool and click Start (You can also run the CPU Usage tool alongside the Application Timeline tool). This launches the application in the profiler. Once you exercise the scenario that you’d like to investigate, you can stop the profiling session by clicking on the Stop Collection link, which starts the analysis of the collected performance data.
Now you can investigate the performance report for optimization opportunities.
Inspecting profiling session details
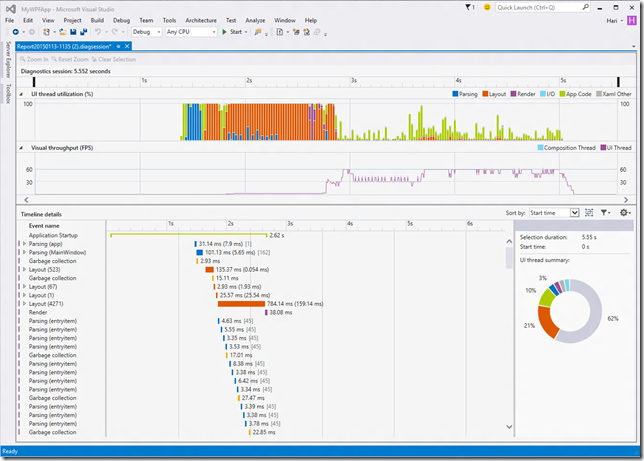
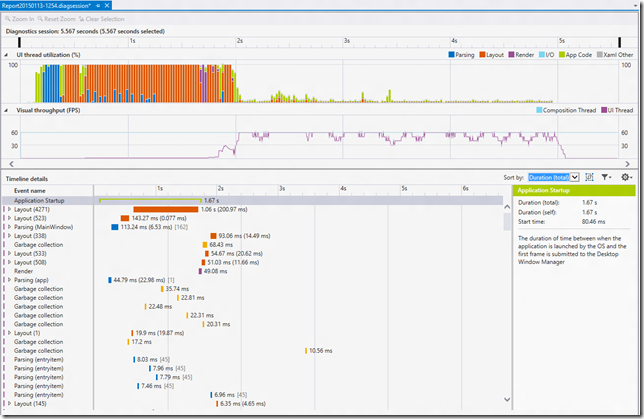
The report shows a chronologically ordered list of interesting events in your application, which directly corresponds to CPU consumption during your application’s execution.
Graphs
Along with the reports, you are also equipped with graphs that detail the UI thread utilization and the Visual throughput (UI and Composition) of your application. These graphs enable you to quickly spot periods of excessive UI thread utilization or low frame rate which might correspond to poor application responsiveness. The UI Thread utilization graph details the time spent by the UI thread in Parsing, Layout, Render, I/O, Application Code and other framework services. Currently, only Disk I/O is computed in I/O. Network I/O support is slated for a future release. The Visual throughput graph details the frame rate of both the UI thread in the application and the Composition thread in the Desktop Window Manager.
After identifying a region of interest, you can further drill down and filter to the events in the selected time range by click-and-dragging the selection on the graphs. You can achieve more fine grained control over the selected time range by using the left/right arrow keys on the ruler handles.
Details View
The details view is where you will be spending most of your time analyzing the report. It shows a detailed view of CPU utilization of your application categorized by the UI Framework subsystem or system component that consumed the CPU. Below is the list of categories and events supported in Visual Studio 2015 CTP 5 for WPF applications. We will continue to enhance this list in the future based on our investigations into real life performance issues and your feedback.
XAML: Layout, Parsing, Render
System: Disk, Network
Other: Garbage Collection
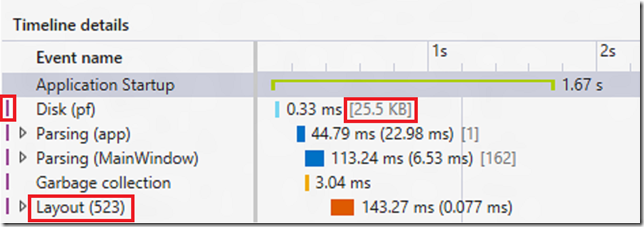
Most of the events occur on the UI thread and are marked as such by the purple bar on the left of the event in the details view. Some of these events have descriptors in their names that enable you to quickly inspect the key property of the event. E.g., the Layout event always shows the number of elements that have taken part in that layout pass. Other events like Disk and Network I/O have hint text that details the total data payload of these requests. This enables you to in many cases co-relate the time consumed by the event to the size of the payload serviced in that time range.
These UI enhancements can be turned off by using the View Settings option in the command bar of the details view.
We also support a variety of filtering options for your convenience that you can access from the Filter option in the command bar. These commands enable you to slice and dice the events in the details view to isolate specific events or regions of interest.
When you find an event of interest, you can drill into it further using the following gestures:
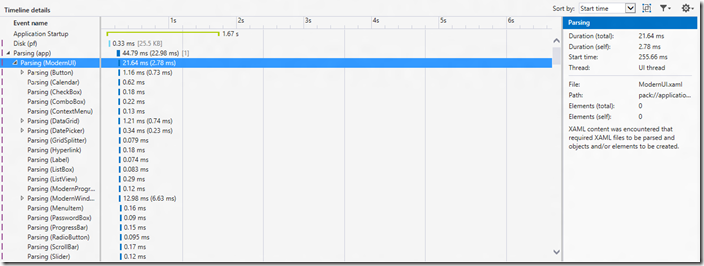
- Selecting the event row will display additional details about it in the detail pane. E.g., selecting a Parsing event will show the full path of the XAML file that was parsed.
- Expanding the event row will display its child events. E.g., expanding a Parsing event will show all Parsing events that was generated as a result of the parent parsing event
By default, the timeline is sorted chronologically. If you want to quickly check out the most expensive events in your session, you can do so by changing the sort type to Duration from Start time.
Some of the key scenarios and optimizations that can be done based on their inspection are given below:
Layout: In large applications, often thousands of elements are shown on the screen at the same time. This might result in a low UI frame rate and correspondingly poor application responsiveness. The Layout event accurately determines the cost of laying out each element (i.e. the time spent in Arrange, Measure, Apply Template, Arrange Override and Measure Override) and builds the visual trees that took part in a Layout pass. You can use this visualization to determine which of your logical trees needs pruning, or to evaluate other deferral mechanisms to optimize your layout pass.
Parsing: This event enables you to identify the total time spent by the UI thread in parsing XAML files and creating objects. It also shows you the dependency chain of all the XAML files that was parsed as a result of the root event. This will enable you to identify unnecessary file parsing and object creation in performance sensitive scenarios and optimize them out.
Disk and Network I/O: Frequent disk access and large network payloads on the UI thread might severely impact application responsiveness . Even if some of these I/O accesses happen on a different thread, it might still impact the perceived responsiveness of the application. These events will detail the total payload and time spent servicing the I/O requests. Currently only network requests serviced through the WININET provider is represented here. Support for other providers will be added in a future release.
Application startup: One of the goals we had laid out while designing the profiler was to make it easy for our customers to quickly identify scenarios of interest in the vast trove of session data that is displayed in the tool. In order to do this, we automatically identify scenarios that we believe are of interest to you and generate semantic events for the same. Application Startup is a semantic event that is created by our tool that measures the interval between application launch by the operating system to the time taken for the application to submit the first frame to the Desktop Window Manager. This measurement in essence captures the startup time of your application. You can choose to filter the session details to this specific scenario by executing the filter to event command in the context menu.
This enables you to quickly identify the events that consume the largest blocks of time in this scenario. In the example above, you can see that Layout event consumes the largest block of time. Optimizing layout here will enable faster application startup.
Frame: If you want to view the total time spent in UI frame creation, you can toggle the Group by Frames option in the command bar. This will group the Layout events and related Render events in a UI thread frame to a semantic Frame event.
Application Code: The Application Timeline tool can be used in conjunction with the CPU Usage tool. This enables you to co-relate excessive App Code execution (observed on the UI Thread utilization graph) to user code that was executed during that time period.
Known limitations
Currently only events from the UI thread of the Main Application Window are shown in the tool. We will be adding support for other UI threads in the application in a near future release of Visual Studio.
Tell us more!
We are interested in knowing more about what you think about our tooling investments in the WPF platform and what you would like to see in the Performance and Diagnostics hub going forward. Please send us your feedback through replies to this post, Connect bugs, User Voice requests, the MSDN diagnostics forum or the Send a Smile button inside Visual Studio.
Author: Harikrishna Menon, Program manager, Visual Studio Client Tools Team Hari is a Program Manager with Microsoft, and works on the Xaml Experiences Team in Visual Studio. He has been with Microsoft for over 6 years, and has shipped multiple versions of Visual Studio working on a variety of XAML platform and tooling experiences spanning different XAML platforms like WPF, Windows Phone and Windows Store. |
Comments
Anonymous
January 16, 2015
This is fantastic however I have to wonder how much value it offers without Windows 7 support. How many enterprises that are the key consumers of WPF are running Windows 8.1?Anonymous
January 16, 2015
"Currently only events from the UI thread of the Main Application Window are shown in the tool. We will be adding support for other UI threads in the application in a near future release of Visual Studio." answered before I asked ! will the UI be updated to utilize multiple threads / GPU processes in W10/DX12 ?Anonymous
January 16, 2015
great! is there a way to add user-defined Events? E.g.: Can a library generate additional Events, or are they hardcoded by the VS/WPF/BCL-Team?Anonymous
January 16, 2015
@MtVernonCannibisFarms: I'm not sure if I get your question. We will adding the ability for you to inspect each individual UI thread at a time. The details view and the graphs will update based on the thread you have selected. Hope that make sense.Anonymous
January 16, 2015
The comment has been removedAnonymous
January 16, 2015
The comment has been removedAnonymous
January 16, 2015
Thank you very much! Do you think it will be possible to make XAML more lightweight and inferring in future? JavaScript and HTML are obviously garbage, but some web frameworks and tools have interesting ideas (LESS, Angular). Have you brainstormed how Roslyn can augment WPF development?Anonymous
January 16, 2015
The comment has been removedAnonymous
January 17, 2015
Will this be ported to Visual Studio 2013? Which edition of Visual Studio 2015 will be required?Anonymous
January 18, 2015
@Dev: Thanks for your feedback. We are not looking into changing the language spec at this time. However, we are looking into enabling even more powerful refactoring (cross language) using the Roslyn platformAnonymous
January 18, 2015
@Benny Tordrup: We are not looking into backporting this to Visual Studio 2013, Visual Studio 2015 CTP 5 is the minimum required version of visual studio for you to use this tooling.Anonymous
January 18, 2015
The comment has been removedAnonymous
January 18, 2015
I second Jesse: Nice tool, but as long as there is no Windows 7 support, it is out of reach for most corporate developers working on "enterprise WPF applications" mentioned.Anonymous
January 18, 2015
The comment has been removedAnonymous
January 19, 2015
Great, but we really need this for Windows 7.Anonymous
January 20, 2015
Any tips on how to know why "Timeline" is not listed as an available tool for my project? We have a mixed mode application which starts a native C++ .exe and quickly creates WPF windows via C++/CLI. I have tried changing the startup project to a C# assembly and to a C++/CLI assembly and the Timeline is still disabled.Anonymous
January 20, 2015
@jschroedi: Great scenario. We look for a specific project types in the startup project before we show the Timeline tool. It looks like we don't have C++CLI in the list. We are looking into adding support for this now. We might either add support for the project type directly or will enable the Timeline tool for exe projects i.e you can open your C++CLI exe as a project in VS and the Timeline tool will show up in the Performance and Diagnostics hub. In the meantime unless you have a WPF project as the startup project, the timeline tool will not show up. Thanks for bringing this scenario up :)Anonymous
January 20, 2015
@Joerg, @Heiko: Thanks for the feedback, we are looking into adding this support in the near futureAnonymous
January 20, 2015
Thanks for the reply Hari! I look forward to being able to use the tool with our project when more project types are allowed.Anonymous
January 21, 2015
Can you point us to code which allows adding a User Mark to the timeline? The best I've found is this but it appears to be for Windows Store apps and not WPF apps: msdn.microsoft.com/.../dn435909.aspxAnonymous
January 21, 2015
@jschroedl : We dont have support for the scenario as of yet in this tool. This is something we are looking at for a future release.Anonymous
January 21, 2015
Is this available in the Community Edition?Anonymous
January 21, 2015
Thank you Hari & team, very nice tool. Much appreciated in the WPF community. Im so glad WPF is a first class citizen again.Anonymous
January 21, 2015
The new Timline tool looks great! Would you know why it would not be enabled for a WPF 4.5 app created with VS 2013? If I create a new WPF project with 2015 then Timeline is enabled as expected. Thanks! BrianAnonymous
January 21, 2015
I like the information the tool provides. Is there a way to integrate it with Coded UI Tests and TFS Build services? I was wondering if there would be a way for me to write automated tests that exercised the UI and this tool built a profile and it could be part of overall testing with maybe CPU usage limits and power consumption limits causing test failures.Anonymous
January 22, 2015
@Carl: Yes, absolutely!Anonymous
January 22, 2015
@TinoMclaren: Thank :)Anonymous
January 22, 2015
The comment has been removedAnonymous
January 22, 2015
@Dave Parvin: At this time, we don't yet support running the profiler or the analysis outside of VS.Anonymous
January 22, 2015
I suspect my scenario also explains why the Live Visual Tree & Properties windows also do not work. grr.Anonymous
January 22, 2015
The comment has been removedAnonymous
January 23, 2015
@Brian: Can you send this to wpfteam@microsoft.com?Anonymous
January 23, 2015
@Hari: I just sent you the project. Thanks for the help!Anonymous
January 27, 2015
Will you revise WPF graphics stack in this year? When we will receive immediate mode rendering capabilities?Anonymous
January 28, 2015
@Harikrishna Menon - is there any workaround that can allow one to debug an .exe WPF app (which isn't the Startup Project) with CTP5 or must we wait for the next VS2015 release?Anonymous
January 29, 2015
@Black_Joker: Can you please reach out wpfteam@microsoft.com with the scenarios that are important to you that require immediate mode rendering capabilities.Anonymous
January 30, 2015
@Harikrishna Menon: I`ve just sent you my email.Anonymous
February 02, 2015
Thank you for everything you do for WPF! Currently, I need investigate a memory leak in our enterprise WPF application and this tools will be handy. How about support for displaying info about life time of some object? It will be very useful at memory leak analysis when I will see how long is some object alive. Thank you.Anonymous
February 08, 2015
Hi i would like to know can we do application profiling without having source code and get insights about the various performance metrices talked about in the blog.Anonymous
February 09, 2015
Hari, do you know yet what edition of VS this will be in? Express, Pro, Ultimate, etc.Anonymous
February 09, 2015
@Cory: While the SKU list is not finalized, it is defintely going to be in Community, and Pro+ SKUsAnonymous
February 09, 2015
@Profiling without source code: You can do this by creating a a simple WPF application, go to its project properties in Visual Studio, and in the debug tab change it to start an external program and give the path to your exe. After that follow the steps in the blog and you should be good to go.Anonymous
February 09, 2015
@manager.programmer: We have a separate tool for that in the Performance and Diagnostics Hub called the Memory Usage Tool, please try it out.Anonymous
February 18, 2015
The comment has been removedAnonymous
February 24, 2015
@Omer Raviv: Create a new WPF project, and in the properties change the start the application to start a external exe and give your exe path. After that you can follow the steps in the post and you will be able to profile the application.Anonymous
March 05, 2015
To be clear: The profiling tool will not appear if you're running CTP6 in Windows 7? It needs to run in Windows 8 to appear?Anonymous
March 05, 2015
@Derek: Yes, currently only Windows 8.1 and above are supported.Anonymous
March 09, 2015
I am running in CTP6 on Win8.1 and my .NET 4.5 project. It's a WPF project but not detecting that it's Timeline-capable. How does VS make the determination that you can run Timeline against your solution? Very confused as to why it's not letting me use this cool utility.Anonymous
March 09, 2015
@Not detecting my app? : You might have the ProjectTypeGuid missing in your csproj. If you add the following property to you csproj, the timeline tool should show up for your project. <ProjectTypeGuids>{60dc8134-eba5-43b8-bcc9-bb4bc16c2548};{FAE04EC0-301F-11D3-BF4B-00C04F79EFBC}</ProjectTypeGuids>
