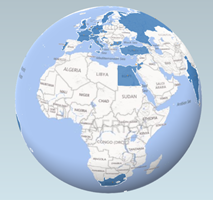
Using Power Map to light up the vast ALM Rangers community
We recently asked our Rangers if anyone is interested in created one visualisation of the distribution of ALM Rangers around the globe.
Chris Margraff mentioned Microsoft Power Map for Excel. It is a three-dimensional (3-D) data visualization tool which allows us to plot geographic and temporal data visually, analyze that data on a 3-D globe and over time, and create visual tours to share with others.
Michael Fourie and Niel Zeeman reacted and the outcome was an interesting set of illustrations and a really informative and “cool” video tour below.
The core message is that the ALM Rangers are truly geographically dispersed. This makes any project a challenging adventure, but means that you are probably not alone out there ![]()
Comments
Anonymous
April 15, 2014
I really like the Video =). Almost missing it =DAnonymous
April 16, 2014
Great visualization! I'm a bit confused though....horses? :-)Anonymous
April 16, 2014
@Tommy, LOL :) It is the storm at sea theme from our ALM Readiness Treasure Map team.


