Add a custom work item field and fetch it in an excel report
This blog post will help you to add a custom field to a work item, and fetch it in an excel report. We will discuss about the different types of reporting attributes that can be set to a work item field and the different ways in which the field can be fetched in a report.
Please note that Microsoft Excel is not the only authoring tool that can be used to create reports from team foundation server. The choice of authoring tool will depend on the type of data that needs to be showcased in the report as well as the choice of data source.
The chart below shows the different authoring tools that are available and the data sources that can be connected to them.
Note: Versions of TFS and Visual Studio used in the examples in this article is 2013 Update 3.
Adding a custom field and specifying the appropriate reportable attribute.
We can use the witadmin command line tool to export a work item type definition, add the new field and import it back, as explained in the article https://msdn.microsoft.com/en-us/library/dd695793.aspx
TFS power tools can also be used to add a new field to a work item type.
witadmin exportwitd /collection:CollectionURL /p:ProjectName /n:TypeName /f:"DirectoryPath/FileName.xml"
Choosing the reportable attribute value
To include a work item field in reports, one of the below values must be assigned to the reportable attribute of the field, based on the type of data:
· Detail: this will export the field to the relational warehouse database but not to the cube. Excel cannot be used to fetch reports from the warehouse database.
Supported data types: Integer, Double, String, or DateTime fields]
· Dimension: this will export the field to both the relational warehouse database and the cube. Useful to include fields that are used to filter reports (for example, fields that have lists of valid values).
Supported data types: Integer, String, or DateTime fields].
· Measure: to support the processing of pre-calculated values in the cube.
Supported data types: Integer and Double
Note: Tfs_Warehouse database is referred to as the relational warehouse database and Tfs_Analysis database is referred as the cube.
Edit the work item type definition to add the new field.
Add the new field in the Fields section of the work item type definition and also make it visible by adding it to the appropriate section in the layout.
For this demo, I am adding a sample field called count to the bug work item type, which has 3 list values. (1, 2 and 3)
 <FIELD name="Count" refname="MyProject.Count" type="Integer" reportable="dimension">
        <ALLOWEDVALUES expanditems="true">
          <LISTITEM value="1" />
          <LISTITEM value="2" />
          <LISTITEM value="3" />
        </ALLOWEDVALUES>
      </FIELD>
Add the control element to the appropriate group in the form section.
<Column PercentWidth="50">
<Group Label="Status">
<Column PercentWidth="100">
<Control FieldName="System.AssignedTo" Type="FieldControl" Label="Assi&gned To" LabelPosition="Left" />
<Control FieldName="System.State" Type="FieldControl" Label="Stat&e" LabelPosition="Left" />
<Control FieldName="System.Reason" Type="FieldControl" Label="Reason" LabelPosition="Left" />
<Control FieldName="MyProject.Count" Type="FieldControl" Label="Count" LabelPosition="Left" />
</Column>
</Group>
</Column>
Import the wit definition back to the project.
Run the witadmin importwitd command to import the modified wit definition to the team project.
witadmin importwitd /collection:CollectionURL /p:ProjectName /f:"DirectoryPath/FileName.xml"
After importing it back, the bug work item looks like below, with the Count field added to the STATUS section, and with three values (1, 2 and 3) to choose.
Fetch the custom field in an excel report
· Once we have imported the modified wit definition to the team project, create few work items and assign a value to the custom count column.
· To view, refresh, or create a Microsoft Excel report that connects to the SQL Server Analysis Services cube, you must be a member of TfsWarehouseDataReaders security role.
· Open an excel work book and connect to the analysis cube.
· Open MS Excel and navigate to the Data tab and then choose From Other Sources -> From Analysis Services.
· In the Data Connection Wizard, enter the name of the Analysis server.
· Click Next and choose the Analysis database form the database drop down list.
· Select the Team System cube and click on Next.
· Specify a name for the Data Connection File and then click on Finish.
· Accept the default values and click OK on the Import Data dialogue box.
Note: We will have to wait for the warehouse and analysis cube to be processed before we can see the new reportable field in the excel report.
Create a report to fetch the value of the custom field.
We will now create a report which will allow us to filter by the custom field that we added – Count.
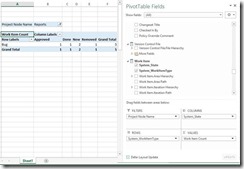
· In the PivotTable Field list, scroll to the Work Item group and drag the System_WorkItemType field item to the Rows and System_State to the Columns.
· From the Team Project group, drag the Project Node Name field item to the Filters.
· From the ∑Work Item group, drag the Work Item count field item to the ∑Values section.
· Filter for the appropriate team project, where we have customized the work item, using the Project Node Name filter.
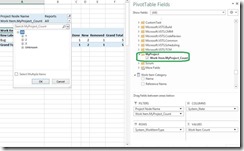
· Now let us add the custom Count field to the filters section. In the Pivot table field list, scroll to the Work Item group and expand the MyProject section. The custom field will be placed under this section, as we specified the reference name for the field as MyProject.Count. Drag and drop the WorkItem.MyProject_Count filed to the filters section.
The report can now be filtered based on the value of the Count field.
Once the table displays data as per the requirements, a pivot graph can also be added. The excel workbook can also be uploaded to the team project portal (SharePoint site)
Content created by – Sreeraj Rajendran
Content reviewed by – Chandra Sekhar Viswanadha


