Understanding the R2 Process Monitoring Management Pack Templates
Management pack templates have been around since RTM of OpsMgr 2007 and R2 introduced a new one specifically for process monitoring. This is a cool template and allows the ability to setup some useful process monitoring, but what is the wizard actually building behind the scenes, and is this what you want? Let’s walk through an example.
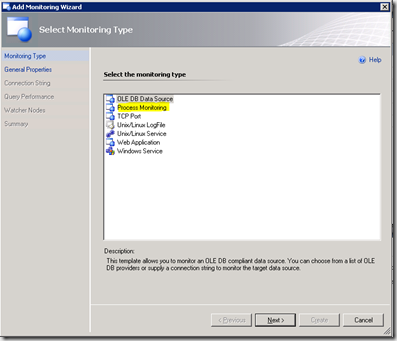
In the authoring node of the OpsMgr console, right click on Management Pack Templates and select add monitoring wizard.
Select the Process Monitoring template and select next.
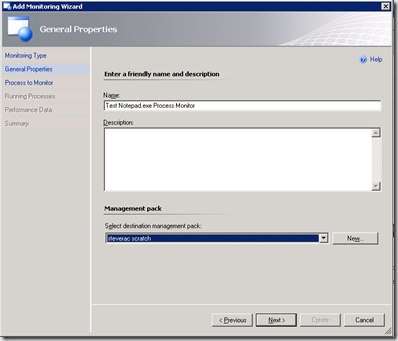
Title your monitor and select a management pack where it should be stored and click next.
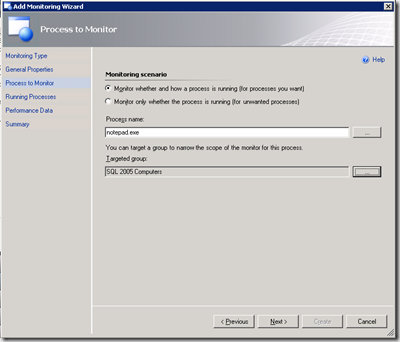
Choose to monitor the notepad.exe process and select a group that will be used to populate the resulting target. Let’s stop here for a minute. Choose a group for targeting? Sounds very MOM 2005ish. Well, what really happens here is that the membership of the group you select is copied into the new target class that the wizard creates. We will see that in a minute. Click next.
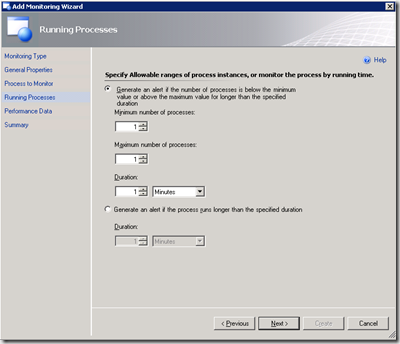
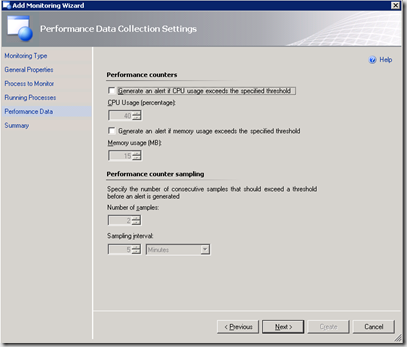
For our demo we will accept the defaults on the next two pages.
So we finish up the wizard by clicking Create on the Summary page and thats it. Easy enough? Using this wizard we now have created monitoring that will run on just the SQL servers that were in my group looking for notepad. Very easy and targeted appropriately. So what pieces were actually created? Let’s take a look.
First, if we review our list of Process Monitors we have the one just created and two others. The other two will come into the discussion shortly.
As we explore the results of the wizard, remember that one of the items requested by the wizard is the group name. We chose SQL 2005 Computers. The membership of this group is as follows
As mentioned, this group is not the target for our monitoring but is used to seed the class created by the wizard. If we take a look at discovered inventory and choose the class that was created we see the the class membership is exactly the same as our group. So, essentially, the membership is a direct copy of the group.
 One thing to bear in mind here, if an agent is listed in a the target group but that agent is having problems it may not run the discovery and, as a result, may not populate into the new target class that the wizard creates.
At this point you might be thinking that you just stumbled across a cool way to build a new target class without having to use the authoring console. Why not just create a group that has all of the systems in it that you want to target for monitoring and use the process monitor wizard to specify the group you created as the target group and convert it to a new class that you can use for targeting something completely unrelated. After all, you can just delete the process monitor when done and you are good to go. Well, good thought but it fails on a couple of fronts – when the process monitor is deleted so is the target class that was created. There is another potential problem as you will see in a minute.
OK, continuing on. What monitoring objects were created by the wizard? To find out just right click on the new process monitor template created in the authoring node and select to view management pack objects. To populate the new target class we have to have an object discovery. Click on object discoveries from the right-click menu and you will see the new discovery created.
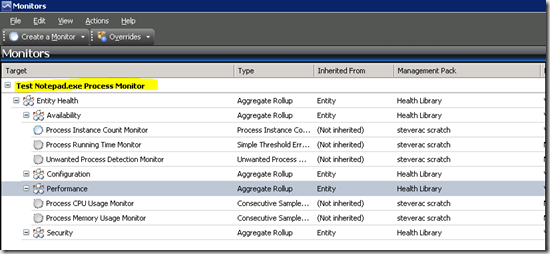
From the same right-click menu select monitors to see the associated monitors that were created.
In addition to monitors, a couple of rules were created. Choose rules from the right-click menu to see them.
Notice that all of the monitors and rules are targeted at the newly created target class Test Notepad.exe Process Monitor.
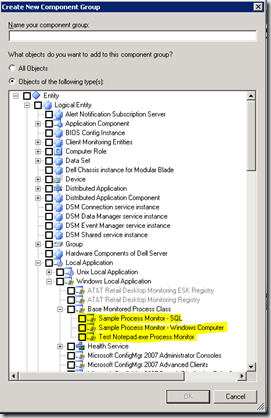
So what do we know so far? We know that the wizard created a new target class that is populated by the newly created object discovery and we know that both rules and monitors are targeted to this new target class. So where does this new target class fit into the overall health structure? If we take a look in the add component menu from distributed application designer and do a bit of searching we find our new target class.
Interesting. So what the wizard actually does is create our new process monitor target class as a child class of the Base Monitored Process Class which is related to Windows Local Application and so on. So anytime our monitors detect an issue the resulting health will be reflected on Windows Local Application and on up the chain.
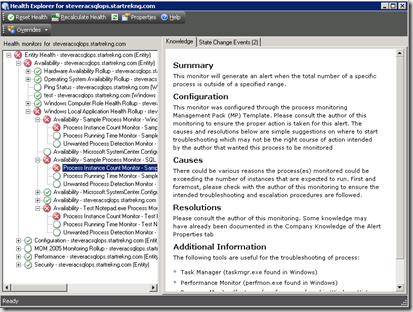
But, wait, I’m monitoring a process on my SQL server. What if that process were a critical piece of SQL server? Shouldn’t a failure of that process impact the health state of SQL server? And now we have arrived at the second issue I mentioned above. If the process is critical to SQL server and you want the health state of SQL server to be impacted when the process fails then this wizard isn’t the answer for you. Very likely you will need to build other monitoring to meet your need. Further evidence of this in the diagram is the fact that I created three total process monitors, two targeted to my SQL server group and one targeted to Windows computer, yet they all reside in the same node illustrating that using this wizard will result in proper monitoring but may not meet your needs in terms of properly fitting in your health structure. For that, creating customized monitoring is your answer.
Comments
- Anonymous
March 30, 2014
thanks , this is very helpful. SCOM Admin
