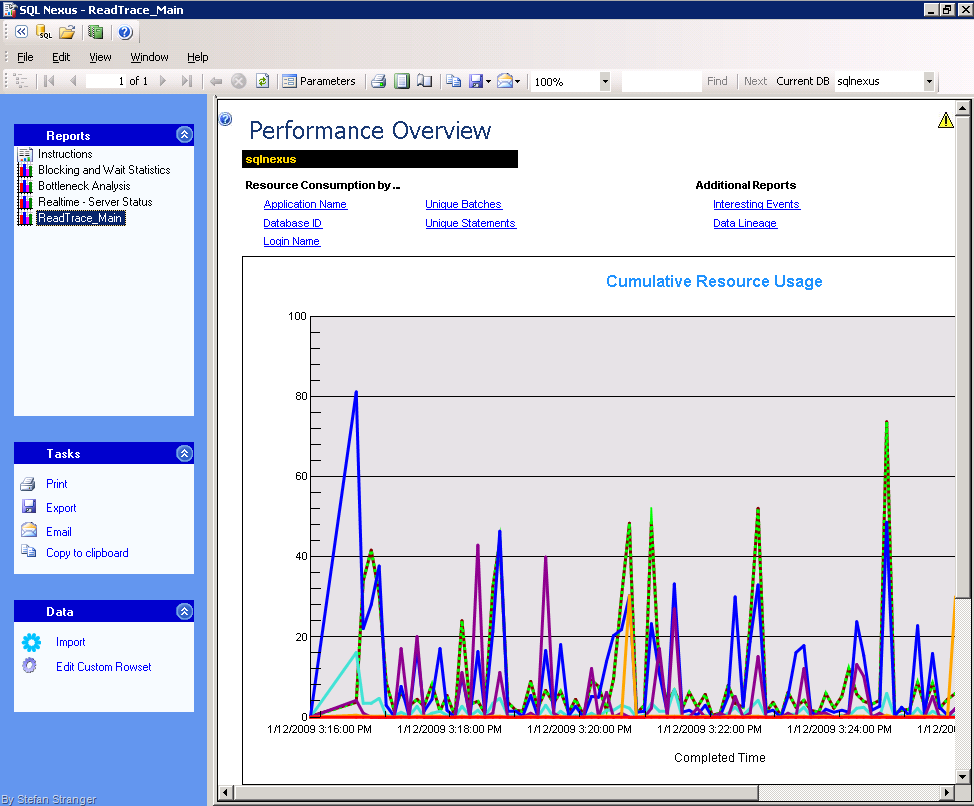
Using SQL Nexus to troubleshoot OpsMgr SQL Server performance issues
SQL Nexus is a tool that helps you identify the root cause of SQL Server performance issues. It loads and analyzes performance data collected by SQLDiag and PSSDiag. It can dramatically reduce the amount of time you spend manually analyzing data.
With the RML Utilities you can answer questions such as the following:
- Which application, database or login is consuming the most resources, and which queries are responsible for that.
- Whether there were any plan changes for a batch during the time when the trace was captured and how each of those plans performed.
- What queries are running slower in today's data as compared to a previous set of data.
If you think you have OpsMgr SQL Server performance issues maybe SQL Nexus together with SQLDiag and RML Utilities can help with performance tuning and analysis.
Steps:
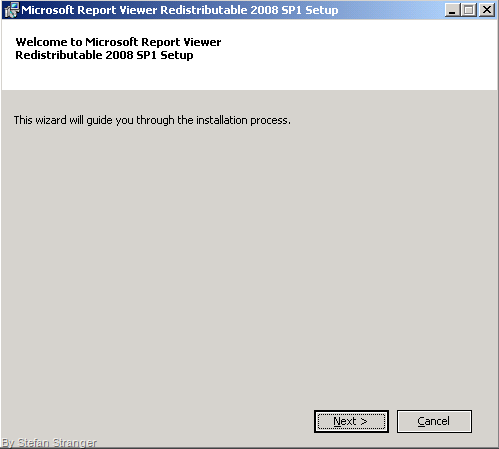
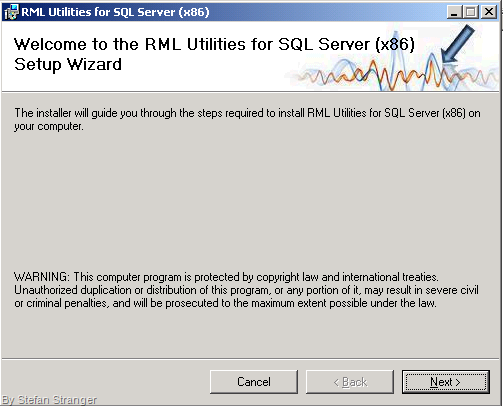
Download SQLNexus , RML Utilities for SQL Server, Microsoft Report Viewer 2008 Redistributable and PerfStatsScript from websites.
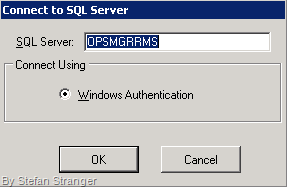
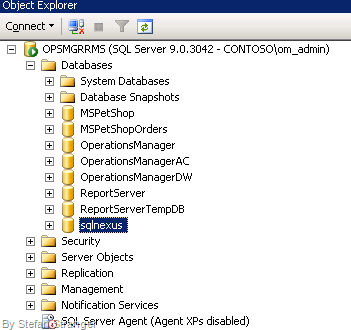
Install\Run SQLNexus by running sqlnexus.exe in folder where you extracted the zipfile.
Create a folder SQLDiag and Unzip PerfStatsScript files to folder.
Open StartSQLDiagTrace.cmd and change configuration as needed.

Give SQL server service account full control on D:\SQLDIAG folder if you aren’t using the local system account.
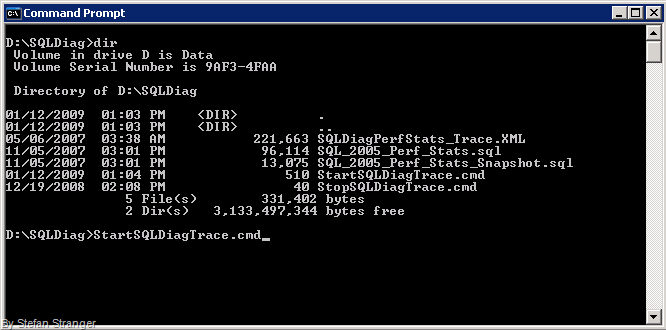
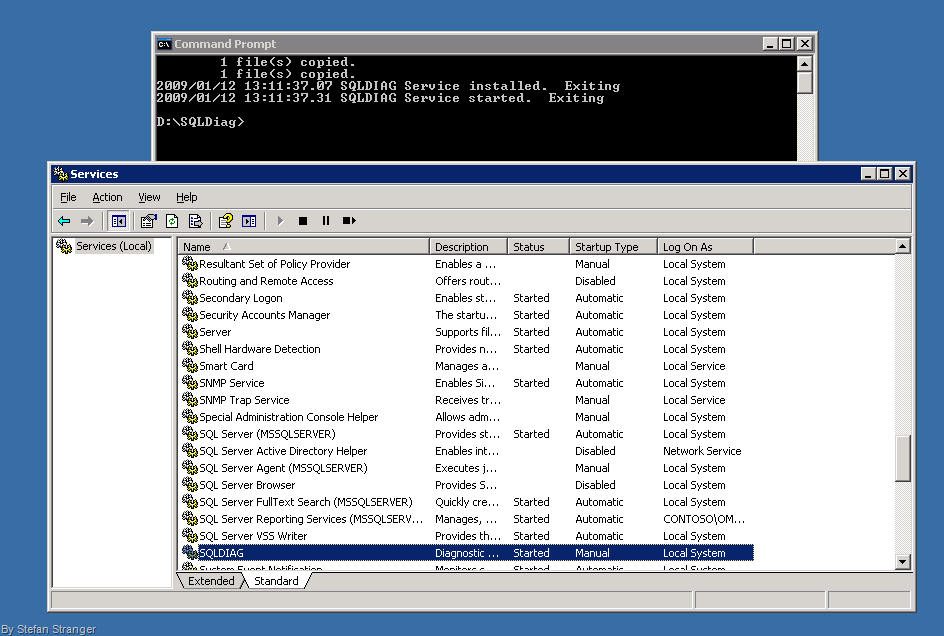
Start D:\SQLDiag\StartSQLDiagTrace.cmd. This script registers sqldiag as a service and starts the service with a template (both profiler and perfmon trace)
Output is being dumped in D:\SQLDiag\SQLDiagOutput folder
Remark:
On a busy system quite some data can be collected!!!!. Watch your freespace carefully! Customer experience on opsmgr environment with 2500 agents 20GB of data is collected in 10 minutes.
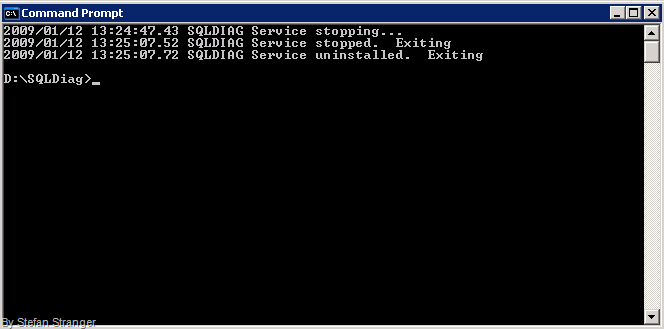
Have it running for 10 mins and then stop the SQLDiag service.Stop SQLDiag with StopSQLDiagTrace.cmd script.
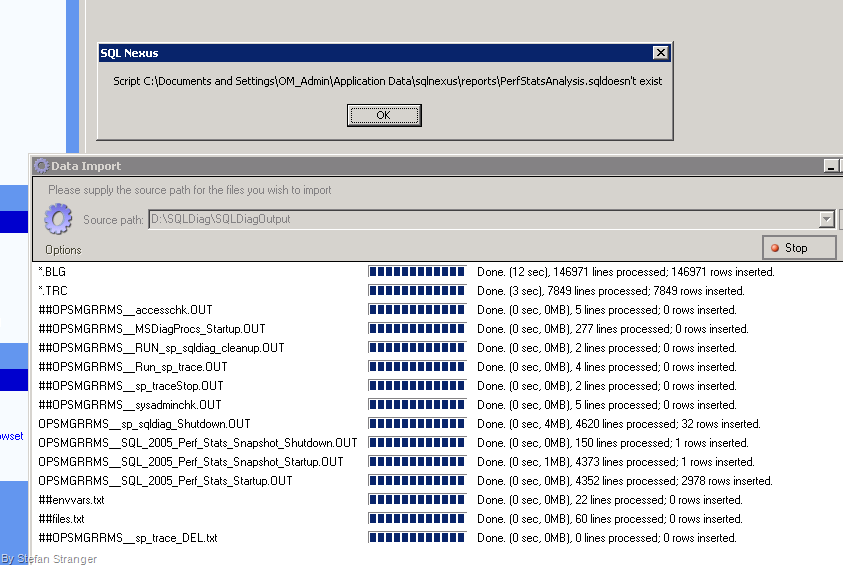
Importing trace data by selecting File\Import in SQLNexus tool.
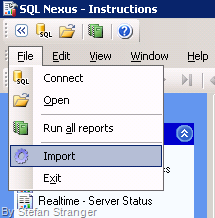
Select Options and select BLG Blaster on Enabled and Drop Current DB before Importing.
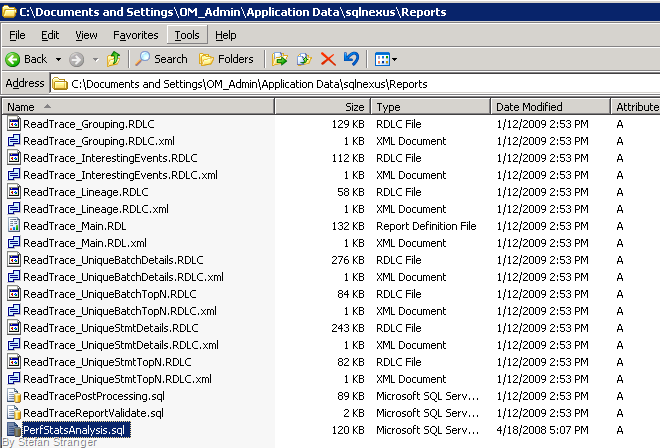
Remark: If you are getting the Message PerfStatsAnalysis.sql doesn’t exist message. Just copy the PerfStatsAnalyis.sql file to the requested folder.
The Next Reports are available:
- Via SQLNexus
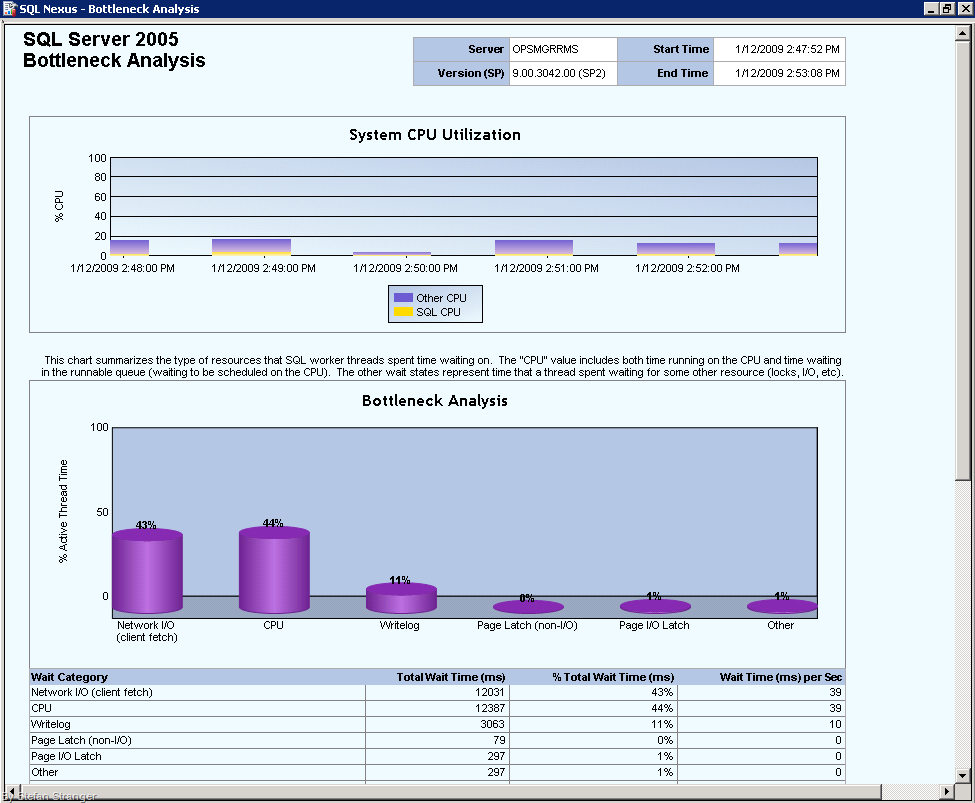
- Bottleneck Analysis
- Blocking and Resource Wait Statistics
- Performance Overview with subreports
- Resource Consumption
- Unique Batch TopN
- Interesting Events
- Via SQLNexus
I want to thank David Scheltens for showing me how to use SQL Nexus and creating the PerfStatsScripts.
References:
SQLNexus
https://www.codeplex.com/sqlnexus
SQLDiag (installed default with SQL2005 and SQL2008)
https://msdn.microsoft.com/en-us/library/ms162833(SQL.90).aspx
PSSDiag (to use with SQL2000)
https://msdn.microsoft.com/en-us/library/aa175399(SQL.80).aspx
RML Utilities
Comments
Anonymous
January 01, 2003
Stephan Stranger a posté sur son Blog un article sur l'utilisation de SQL Nexus pour résoudre des problèmes...Anonymous
January 01, 2003
Thanks for this post. I'm a big fan of SQL Nexus, but admittedly it can be a nuisance to install and get working reliably as there's quite a few steps and they're not documented very well on Codeplex. This is a great guide.Anonymous
January 01, 2003
Hi Scott, Thanks for the nice words! I am/was a newbie on SQLNexus so I probably hit all the problems during the install ;-) Regards, Stefan Stranger
