Tracing SharePoint 2010 Service Applications
If you are interested (as I was) to know what happens behind the scenes in a SharePoint 2010 Service Application, there’s a very neat way to do this. I had a specific scenario where I had to understand what happens in the back-end of BCS service application I provisioned, so I’ll use that example as an illustration here.
We can use WCF tracing infrastructure to identify why a service application fails, what exceptions it encountered (if any) or simply to know what happens when we do a particular action through the UI of the service application.
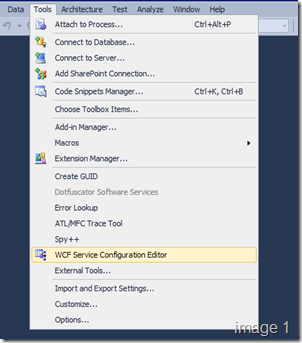
First, we’ll need to add the trace references in the configuration file of the service we are interested in sniffing. To do that we open up Visual Studio 2010 (even VS2008 should be fine I guess) and from the tools menu option, select “WCF Service Configuration Editor” (image 1).
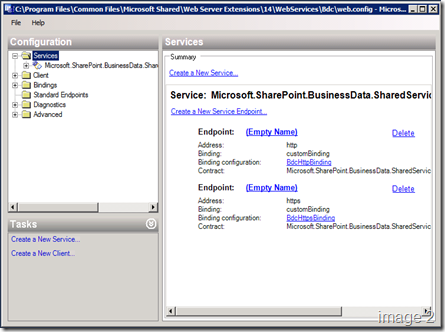
Once configuration editor opens up, choose File > Open > Config File and provide the path to the web.config file of the service we are interested in. In my case, it is the web.config file located at: “C:\Program Files\Common Files\Microsoft Shared\Web Server Extensions\14\WebServices\Bdc” path on my server.
Before we make changes to this file using configuration editor, creating a backup of the web.config file would be a splendid idea!
When configuration editor opens up the web.config file, it should look something like what’s shown in the image (image 2).
Now, for tracing… the “Diagnostics” configuration node is the one that’s interesting to us.
When we first click on the “Diagnostics” node in the configuration editor tool, we’ll see that the following options:
1. MessageLogging
2. Tracing
Are disabled. We need to click the “Enable Message Logging” and “Enable Tracing” links found just besides them to turn them ON.
Basically, tracing tells us the following:
1. What communications occurred.
2. What exceptions occurred and when did they occur.
3. How often clients call each method of a service.
And messages tells us the following:
1. First of all, it uses the tracing infrastructure to formulate some useful information.
2. The content of the messages that client and services exchanged.
3. It also sniffs through the messages and verifies if client and services exchanged correct and expected data.
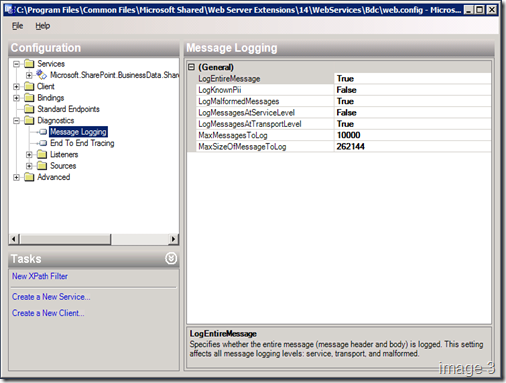
Once trace and message logging are enabled, we expand the “Diagnostics” node. Let’s now setup the message logging configuration. This is where we specify what type of messages we need our logger to record and some other configurable parameters.
We need to be sure that:
LogKnownPii
LogMessagesAtServiceLevel
Are both set to “False”. I don’t know the actual reason as to why these aren’t recognized as the correct attributes. But I ran into some errors when I had these set to “True”.
I think we can play around with the other two parameters, the MaxMessagesToLog and MaxSizeOfMessageToLog. It’s quite self-explanatory as to what it’s there for.
Then, we move over to the “End To End Tracing” node.
Surprise! End-To-End tracing doesn’t seem to work as well. I need to read up a bit on what this is. Something new in VS 2010 (or .NET 4.0 perhaps). But for now, let’s just set all the options we see in “End To End Tracing” node to “False”. The specific options that should be available are: ActivityTracing, MessageFlowTracing & PropagateActivity.
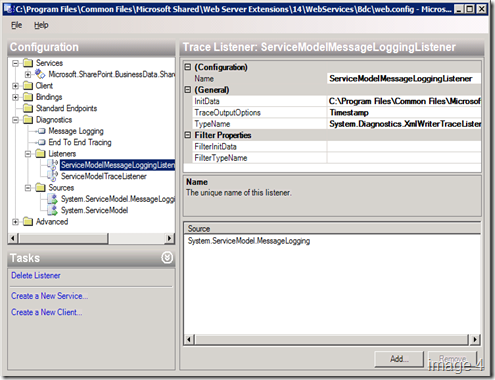
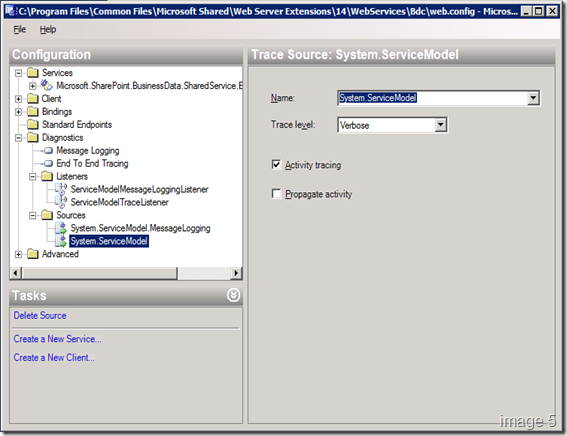
Let’s then expand the “Listeners” and “Sources” nodes. This is where we can configure what type of output we want our message and trace logging information as. By default, the System.Diagnostics.XmlWriterTraceListener (image 4) is used for both message and trace logging. But we can change it to other options if we want to.
The “Sources” section is where we specify what level of information we’d like to see in our trace file. It’s okay to set the properties for System.ServiceModel.MessageLogging, but I don’t think it’s actually required.
In my case, I setup verbose level output for System.ServiceModel as shown in the image (image 5).
Ok! Now we are all set. Just choose File > Save. And close WCF Configuration Editor.
There might be one small change required in the resulting web.config file. And that is to change the assembly information for System assembly in the <sharedListeners> element of the <system.diagnostics> element.
Seems like this references System assembly with version 4.0.0.0 and this wouldn’t work. We’ll need to simply change it to the following:
<add initializeData="C:\Program Files\Common Files\Microsoft Shared\Web Server Extensions\14\WebServices\Bdc\web_messages.svclog"
type="System.Diagnostics.XmlWriterTraceListener, System, Version=2.0.0.0, Culture=neutral, PublicKeyToken=b77a5c561934e089"
name="ServiceModelMessageLoggingListener" traceOutputOptions="Timestamp">
<filter type="" />
</add>
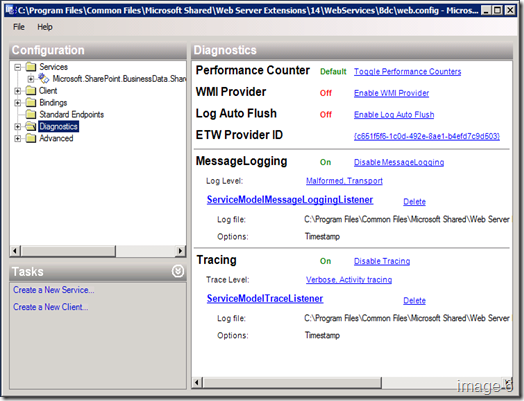
There will be 2 of these (one for message and the other for trace) listeners. We need to change it in both places. We are all done with regards to enabling tracing of the BCS service application. The location where this log file (*.svclog) would be stored is: C:\Program Files\Common Files\Microsoft Shared\Web Server Extensions\14\WebServices\Bdc\. But we can also change it either directly in the web.config file OR from the initial screen displayed in the “Diagnostics” node as shown in image (image 6).
Now, let’s try browsing to our BCS service application to see what happens behind the scenes.
I go to Central Administration Site > Manage service applications. And click the BCS service application I’ve got provisioned in my farm.
That should be it! We should see 2 log files:
web_messages.svclog
web_tracelog.svclog
At the location: C:\Program Files\Common Files\Microsoft Shared\Web Server Extensions\14\WebServices\Bdc.
If the *.svclog files are mapped to “SvcTraceViewer.exe” application in our environment, we should be able to double-click on the individual files to open it in WCF trace viewer. If not, just associate *.svclog files to “SvcTraceViewer.exe” – this tools comes along with .NET Framework SDK. But if we have VS2010 installed, these small aspects should be taken care off for us.
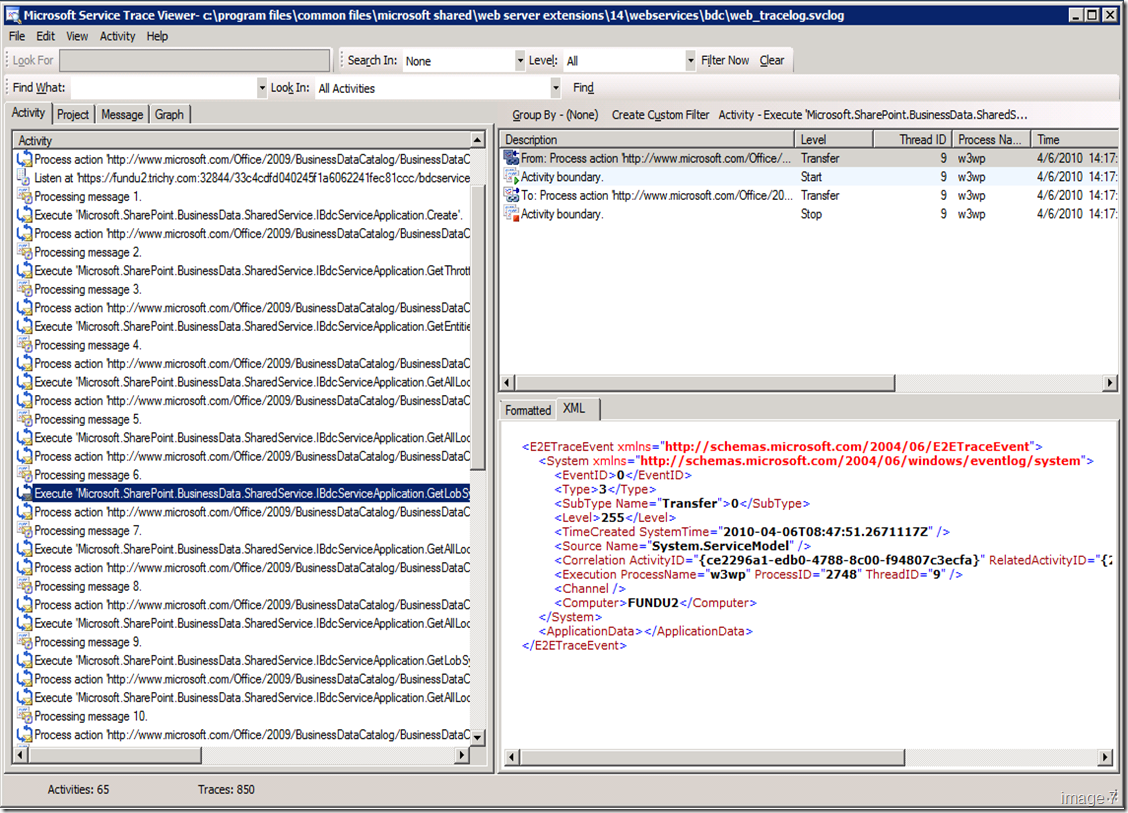
The web_tracelog.svclog file will give us information on the different communications that occurred and the number of times clients call the methods in the service. We can browse through it to get a good picture on it. (sample in image 7)
The web_messages.svclog file would be the one that would interest us more if we need to know what the service application does in the background.
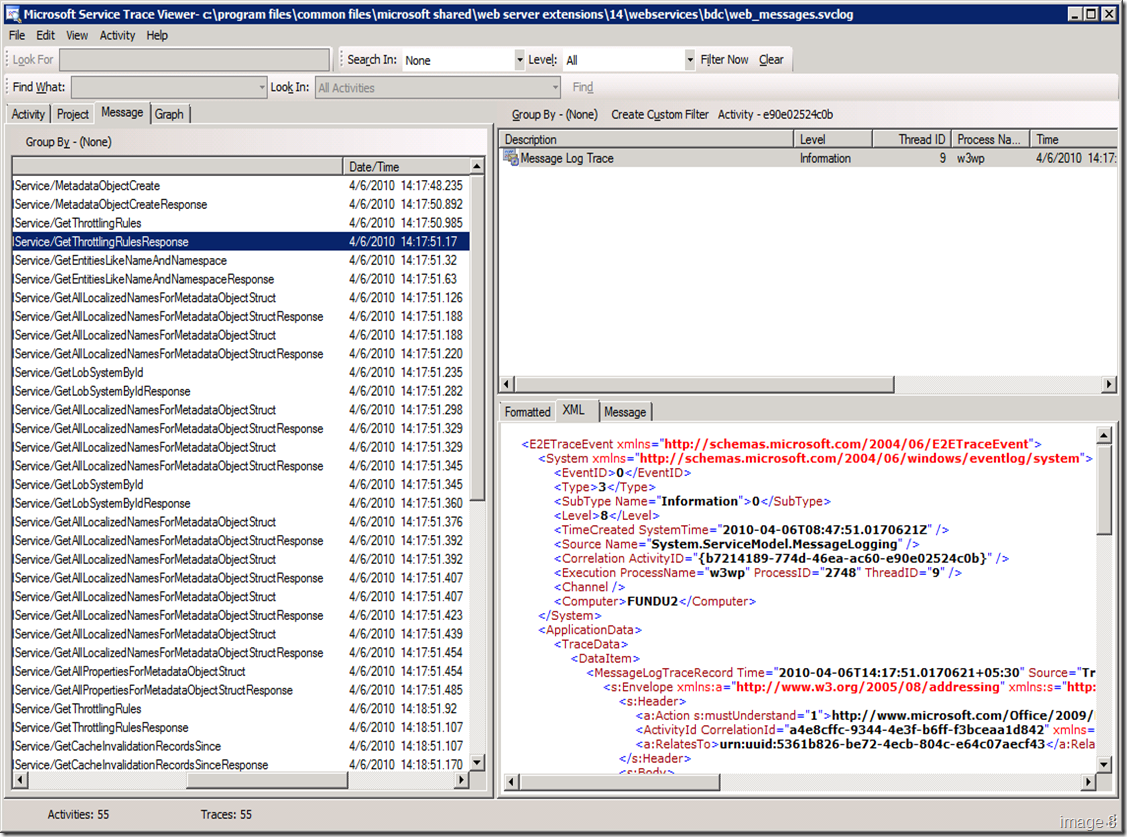
For guys like me, this is much easier to understand. Especially, when we switch to “Message” tab and view the results in XML format. For example, the image above (image 8), shows that there was a call made to “GetThrottlingRules” and there was a response to it “GetThrottlingRulesResponse”. And if we dig into the “GetThrottlingRulesResponse” XML, we can see the different throttling limit that’s set in the service application for: Connections (default:200;max:500), Database Items (default:2000;max:1000000), Database Timeout (default:180000;max:600000), Size for WebService (default:3000000;max:150000000), Size for WCF (default:3000000;max:150000000) & WCF Timeout (default:180000;max:600000).
As you might say and I completely agree… the above information could be retrieved through SharePoint 2010 Management Shell. But I find this approach much easier and quicker to understand what’s happening at the back-end. Further, this could come in very handy in cases where you might see an anomaly OR see that something isn’t simply working!
And yes, I wouldn’t have my production environment setup with WCF tracing enabled at all times. So, if you see any issues with service application and want to be able to see what’s happening, enable WCF tracing following the above steps, replicate the issue/steps so that the messages passed back-and-forth are captured in the log files and disable WCF tracing.
Hope this post was useful! Do leave a comment or share your thoughts on service applications in SharePoint 2010.
Comments
Anonymous
April 09, 2010
Hi Sridhar, Really good to see this fantastic post about the tracing of service application. I am sure that this will give a very good help to the users to understand what is happening internally with WCF services and troubleshoot issues. Keep blogging about SPS 2010 :) Regards, SowmyanAnonymous
April 05, 2011
have you tried tracing the user profile service application? I've tried to follow your instructions but that doesnt apply to the user profile service app.Anonymous
July 25, 2012
Hi. I've tried to follow the instructions you posted here blogs.msdn.com/.../tracing-sharepoint-2010-service-applications.aspx to trace a custom Webservice, which is deployed under ISAPIMyFolder This is my .scv <%@ ServiceHost Language="C#" Debug="true" Service="MyDll, $SharePoint.Project.AssemblyFullName$" CodeBehind="MyServcice.svc.cs" Factory="Microsoft.SharePoint.Client.Services.MultipleBaseAddressWebServiceHostFactory, Microsoft.SharePoint.Client.ServerRuntime, Version=14.0.0.0, Culture=neutral, PublicKeyToken=71e9bce111e9429c"%> I've also tried to remove the Factory and configure the WCF by hand and then enable the tracing, but it didn't work :( Any idea?
