Performance impact of memory grants on data loads into Columnstore tables
Reviewed by: Dimitri Furman, Sanjay Mishra, Mike Weiner, Arvind Shyamsundar, Kun Cheng, Suresh Kandoth, John Hoang
Background
Some of the best practices when bulk inserting into a clustered Columnstore table are:
- Specifying a batch size close to 1048576 rows, or at least greater than 102400 rows, so that they land into compressed row groups directly.
- Using concurrent bulk loads if you want to reduce the time to load.
For additional details, see the blog post titled Data Loading performance considerations with Clustered Columnstore indexes, specifically the Concurrent Loading section.
Customer Scenario
I was working with a talented set of folks at dv01 on their adoption of SQL Server 2017 CTP on Linux which had a Columnstore implementation. For their scenario, the speed of the load process was of critical importance to them.
- Data was being loaded concurrently from 4 jobs, each one loading a separate table.
- Each job spawned 15 threads, so in total there were 60 threads concurrently bulk loading data into the database.
- Each thread specified the commit batch size to be 1048576.
Observations
When we tested with 1 or 2 jobs, resulting in 15 or 30 concurrent threads loading, performance was great. Using the concurrent approach, we had greatly reduced the load time. However, when we increased the number of jobs to 4 jobs running concurrently, or 60 concurrent threads loading, the overall load time more than doubled.
Digging into the problem
Just like in any performance troubleshooting case, we checked physical resources, but found no bottleneck in CPU, Disk IO, or memory at the server level. CPU on the server was hovering around 30% for the 60 concurrent threads, and that was almost the same as with 30 concurrent threads. Mid-way into job execution, we also checked DMVs such as sys.dm_exec_requests and sys.dm_os_wait_stats, and saw that INSERT BULK statements were executing, but there was no predominant wait. Periodically, there was LATCH contention, which made little sense – given the ~1 million batch sizes, data from each bulk insert session should have landed directly in its own compressed row group.
Then we spot checked the row group physical stats DMVs, and observed that despite the batch size specified, the rows were landing in the delta , and not into the compressed row groups directly, as we expected they would.
Below is an example of what we observed from sys.dm_db_column_store_row_group_physical_stats:
select row_group_id, delta_store_hobt_id,state_desc,total_rows,trim_reason_desc
from sys.dm_db_column_store_row_group_physical_stats
where object_id = object_id('MyTable')
As you may recall from the previously referenced blog, inserting into the delta store, instead of into compressed row groups directly, can significantly impact performance. This also explained the latch contention we saw since we were inserting from many threads into the same btree. At first, we suspected that the code was setting the batch size incorrectly, but then we ran an XEvent session and observed the batch size of 1 million specified as expected, so that wasn’t a factor. I didn’t know of any factors that caused a bulk insert to revert to delta store when it was supposed to go to compressed row groups. Hence, we collected a full set of diagnostics for a run using PSSDIAG, and did some post analysis.
Getting closer…
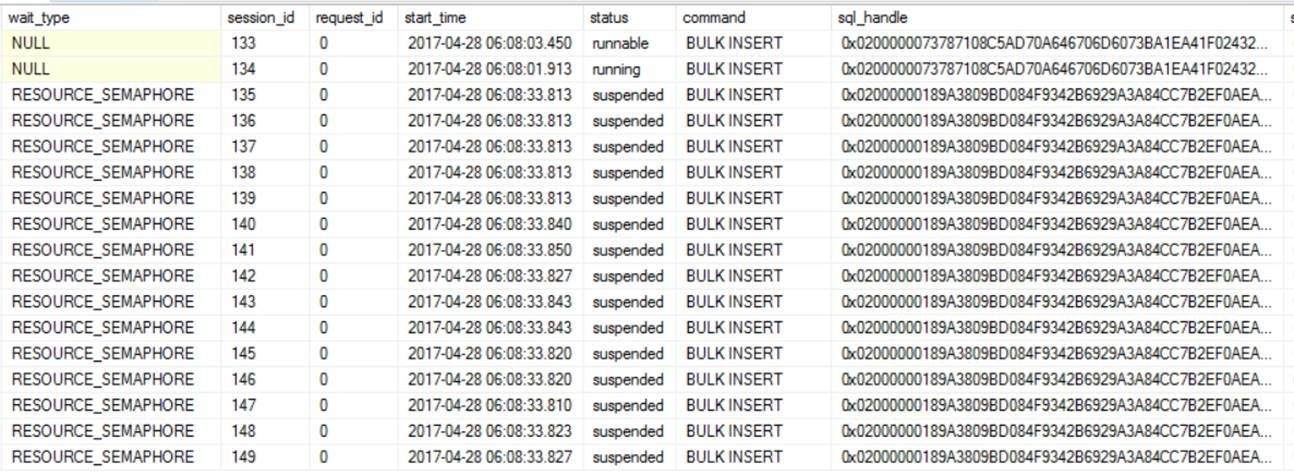
We found that only at the beginning of the run, there was contention on memory grants (RESOURCE_SEMAPHORE waits), for a short period of time. After that and later into the process, we could see some latch contention on regular data pages, which we didn’t expect as each thread was supposed to insert into its own row group. You would also see this same data by querying sys.dm_exec_requests live, if you caught it within the first minute of execution, as displayed below.
[caption id="attachment_6075" align="alignleft" width="1294"] Figure 1: Snapshot of sys.dm_exec_requests[/caption]
Looking at the memory grant DMV sys.dm_exec_query_memory_grants, we observed that at the beginning of the data load, there was memory grant contention. Also, interestingly, each session had a grant of ~5GB (granted_memory_kb), but was using only ~1GB (used_memory_). When loading data from a file, the optimizer doesn’t have knowledge of number of rows in the file and memory grant is estimated based on the schema of the table, taking into account maximum length of variable length columns defined. In this specific case, this server was commodity hardware with 240 GB of memory. Memory grants of 5 GB per thread across 60 threads exceeded the total memory on the box. If this were a larger machine, this situation would not arise. You can also observe multiple sessions that have requested memory, but memory has not yet been granted (second and third rows in the snapshot in Figure 2). See additional details on memory grants here.
[caption id="attachment_6085" align="alignleft" width="1331"] Figure 2: Snapshot of sys.dm_exec_query_memory_grants[/caption]
Root cause discovered!
We still didn’t know the reason for reverting into delta store, but armed with the knowledge that there was some kind of memory grant contention, we created an extended event session on the query_memory_grant_wait_begin and query_memory_grant_wait_end events, to see if there were some memory grant timeouts that caused this behavior. This XE session did strike gold; we were able to see several memory grants time out after 25 seconds and could correlate these session_ids to the same session_ids that were doing the INSERT BULK commands.
[caption id="attachment_6095" align="alignleft" width="933"] Figure 3: Output of Extended event collection. Duration of wait is the difference between the query_memory_grant_wait_end and query_memory_grant_wait_begin time for that specific session.[/caption]
Collecting a stack on the query_memory_grant_wait_begin extended event and with some source code analysis, we found out the root cause for this behavior. For every bulk insert we first determine whether it can go into a compressed row group directly based on batch size. If it can, we request a memory grant with a timeout of 25 seconds. If we cannot acquire the memory grant in 25 seconds, that bulk insert reverts to the delta store instead of compressed row group.
Working around the issue
Given our prior dm_exec_query_memory_grants diagnostic data, you could also observe from Figure 2 that we asked for a 5GB grant, but used only 1GB. There was room to reduce the grant size, to avoid memory grant contention, and still maintain performance. Therefore, we created and used a resource governor workload group that reduced the grant percent parameter to allow greater concurrency during data load. We then tied this workload group via a classifier function for just the login that the data load jobs were executed under. We first lowered the grant percentage to 10% from the default %, but even at that level, we couldn’t sustain 60 sessions concurrently bulk loading due to RESOURCE_SEMAPHORE waits, as each memory grant requested was still 5 GB. We iterated on the grant percentage a couple times, lowering it until we landed at 2% for this specific data load. Setting it to 2% means that we are preventing a query from being able to get a memory grant greater than 2% of the target_memory_kb value in the DMV sys.dm_exec_query_resource_semaphores. Binding the specific login that was only used for data load jobs to the workload group prevented this configuration from affecting the rest of the workload. Only load queries ended up in the workload group with the 2% limit on memory grants, while the rest of the workload used the default workload group configuration. At 2%, the memory grant requested for each thread was around 1GB, and allowed the level of concurrency we were looking for.
-- Create a Workload group for Data Loading
CREATE WORKLOAD GROUP DataLoading
WITH (REQUEST_MAX_MEMORY_GRANT_PERCENT = 2)

-- If the Login is DataLoad it will go to workload group DataLoading
DROP FUNCTION IF EXISTS DBO.CLASSIFIER_LOGIN
GO
CREATE FUNCTION CLASSIFIER_LOGIN ()
RETURNS SYSNAME WITH SCHEMABINDING
BEGIN
DECLARE @val varchar(32) = 'default';
IF 'DataLoad' = SUSER_SNAME()
SET @val = 'DataLoading';
RETURN @val;
END
GO
-- Make function known to the Resource Governor as its classifier
ALTER RESOURCE GOVERNOR WITH (CLASSIFIER_FUNCTION = dbo.CLASSIFIER_LOGIN)
GO
Note: Usually with memory grants, you can often use query level hints MAX_GRANT_PERCENT and MIN_GRANT_PERCENT. In this case given it was an ETL workflow there wasn’t a user defined query to add the hint for example in the case of an SSIS package.
Final Result
Once we did that, our 4 Jobs could execute in parallel (60 threads loading data simultaneously) in the same timeframe that our prior 2 Jobs, reducing total data load time significantly. Running 4 jobs in parallel in almost the same interval of time allowed us to load twice the amount of data, increasing our data load throughput.
| Concurrent Load Jobs | Tables Loaded | Threads loading data | RG Configuration | Data Load Elapsed Time (sec) |
| 2 | 2 | 30 | Default | 2040 |
| 4 | 4 | 60 | Default | 4160 |
| 4 | 4 | 60 | REQUEST_MAX_MEMORY_GRANT_PERCENT = 2 | 1040 |
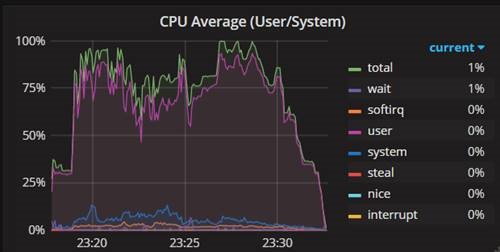
We could drive CPU to almost 100% now, compared to 30% before the Resource Governor changes.
[caption id="attachment_6105" align="alignleft" width="500"] Figure 4: CPU Utilization Chart[/caption]
Conclusion
Concurrently loading data into clustered Columnstore indexes requires some considerations including memory grants. Use the techniques outlined in this article to identify if you are running into similar bottlenecks related to memory grants, and if so use the Resource Governor to adjust the granted memory to allow for higher concurrency. We hope you enjoyed reading this as much as we enjoyed bringing it to you! Feedback in the Comments welcome.
Comments
- Anonymous
June 02, 2017
Nice Analysis,One question though...when you say 4 threads or 5 threads,did you arrive that number from sys.dm_Exec_requests dmv..sorry if this doesnt make sense- Anonymous
June 02, 2017
John, am not sure what specific part you are referring to. If you are talking about threads waiting on a grant, yes you can get that from dm_exec_requests or from the Extended event session or the memory grant DMVs
- Anonymous
- Anonymous
June 02, 2017
Great post Denzil! Thanks for sharing it. - Anonymous
June 04, 2017
Very good read!!!
