Reporting on SCOM Data: A Single Pane of Glass
Over the past 6 months or so, I've been building SSRS and Power BI reports based on SCOM data. At first glance, this sounds super simple. Just write some reports on top of the SCOM DW db. However, rarely are things ever that simple.
My customer had requirements that everyone from executives to technicians be able to use these reports. In effect, they're wanting a "single pane of glass" across their entire enterprise providing useful information up and down their management chain.
You might ask, why not just give everyone access to the SCOM console and be done with them? I'm no SCOM guy (yes, that's a disclaimer), but apparently there is a limitation of about 50 users on the SCOM console. This particular customer had a much higher number that need/want access to it. This means we'll really have to limit access to ensure acceptable performance. Finally, the customer wanted their own hierarchical categorization (from AD) of the data. This would enable them to slice and dice in a manner that matches their business practices.
Executives (and other managers) wanted aggregated maps and charts of Health and Alert data with drill-down capabilities to the host level. Technicians want to see the details they need to fix the issue (e.g. - Alerts, Performance metrics). Aggregating and rolling up data is easy enough for the execs and mangers, but providing meaningful real-time data to the technicians can be another beast. Do we report against the SCOM DW db? Do we ETL everything we need into our own db? That can be tricky, especially when/if that server is experiencing performance issues. I've seen cases with the SCOM DW db where data is late arriving and doesn't get picked up in the normal query window. Then your data and reports are missing records. Not a good experience when wanting to see real-time data. And what about the hierarchical categorization? How does that fit in?
Ultimately, we settled on a fairly simple, hybrid approach of ETL'ing into our database for reporting the aggregates/rollups and querying directly from the SCOM DW db for real-time data. This enabled us to address use cases for executives, technicians, and everyone in between. Specifically for the technician-level users, we built reports on top of the SCOM DW db, but linked to them from the drill-down reports querying the reporting db. This addressed a vast majority of their needs. If they needed anything deeper, then SCOM console is still available. This approach enabled us to correlate the hosts and aggregates with the customer's hierarchical categorizations. At the same time, we were able to give the technicians the tools that they need to troubleshoot and address problems in real-time, but not overload requests from the SCOM console.
Here's small snippet of the North American offices as identified by their aggregated SCOM Health across their core services (think Directory Services, Collaboration, Database, Mail, etc.). Selecting a particular office, you can drill down into the core services being monitored in that office.

Drilling down from the above map, we have an example of deeper core services health monitoring. Here we can see how many servers in the enterprise are in a given SCOM Health State. Clicking each of the slices drills into a report of hosts within that Health State for that given service.

This snapshot is a report that shows the hosts within a given Health State for a given service, along with links to the SCOM Web Console Health Explorer (Server Name), Alert Views (Open Alerts), and Performance Monitor.

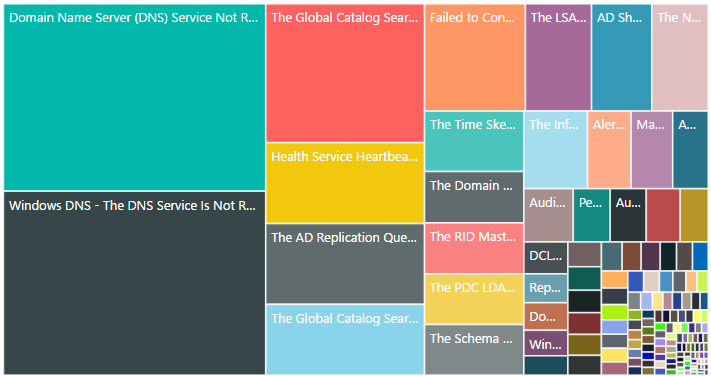
We're also aggregating Alert counts with a tree map for the most common occurrences, enabling task prioritization for technicians. Clicking each Alert drills down in the hosts that are reporting the specific Alert.

And Alert counts over the last 7 days provides trending some trending.

The result of all of this? A reporting solution that provided visibility into the customer's entire enterprise that they had never had before. We were able to proactive monitoring capabilities and the customer loved it! So much so that they've extended our engagement for integration with other data sources like SCCM, network scanning records results, and network device data.
In the end, deciding when to ETL data from SCOM for reporting purposes came down to determining the cutoff point of where the aggregations stopped and the real-time data began. Following this blue print with the upcoming data sources, we'll be able to bring even more value to the customer by giving them a much deeper picture of their enterprise.
Viel spass!
Joseph
23 Apr 2017 UPDATE: My follow up post can be found here.
Comments
- Anonymous
April 17, 2017
Hi Joseph -Thank you for sharing us this report. Would you mind share us how did you do this?Cheers!Marlon- Anonymous
April 18, 2017
Hi Marlon,I'm already working on Part 2 of this topic. It is discussing/explaining how we brought the data together. It will include specific queries and table schemas.Thanks for commenting!-Joseph
- Anonymous